Recently, I had been about to upgrade my Linux distro on my main workstation at home, and this brought an upgrade to GCC 4.8 from 4.7 as the base GCC version. Before I upgraded the distro I tried building Imagine with 4.8.3 built from source, and needed to fix some template code as g++ 4.8+ (ICC has never liked it either) now doesn’t like using pure abstract classes as a template type. I made this change to the code, and did some quick approximate benchmarks between 4.7.3 and 4.8.3 which showed there wasn’t really any improvement, so I decided to try 4.9.2 which had just been released. This seemed to showed a fairly serious regression in terms of speed (speed being a pretty important aspect for a renderer), so I decided I’d do a more comprehensive comparison of the latest main compilers for the Linux platform, as back in 2011 and 2012 I used to do compiler benchmarks (GCC, Clang and ICC) regularly every six months or so on my own code (including Imagine), and on the commercial VFX compositor made by the company I worked for at the time, and it had been a while since I’d compared them myself.
I’ve never really liked just doing micro-benchmarks/synthetic benchmarks of just loops, etc of simple code, as they can paint a distorted picture of what’s going on, which can’t always be realised when the same code is put in context within other code - a good example of this is C++ virtual function overhead, which I’ve previously benchmarked, and while it’s possible to see overheads in micro-benchmarks, the same code within an actual real application shows no issues (at least in my particular usage of them) - so I always try to benchmark code doing what it was designed for from a user’s perspective: in Imagine’s case, this is rendering, or aspects related to that.
As it stands now, Imagine consists of over 164,000 lines of C++ code (including comments) in 386 .cpp files and 484 .h files, included heavily (more-so than I’d like, as it causes pretty severe final binary code bloat) templated code for everything from the acceleration structures, image texture / filtering infrastructure to geometry attribute / indices / triangle type code and a fair amount of SSE intrinsics usage for some of the acceleration structures, image filtering, procedural noise textures and triangle packet intersection code. The rest of the code is standard 2003 C++ - GCC 4.1.2 is still used heavily in the VFX industry (due to plugin ABI compatibility issues), so I still want to be able to build Imagine with this compiler if need be. Other than (optional) image library libs (OpenEXR, libpng, libtiff, libjpeg) for file readers/writers, there are no other requirements/dependencies Imagine needs to build.
The compilers I eventually benchmarked were: GCC 4.7.3, GCC 4.8.3, GCC 4.9.2, Clang 3.6 (prerelease from SVN - with -enable-optimized configure option) and Intel ICC 15.0 trial. I did spend several hours trying to get GCC 5.0 prerelease built from SVN, but gave up after I couldn’t get it to accept either my system zlib installation or a custom one I built from source - googling seemed to indicate this was a multilib compatibility issue and I could get around it by symlinking include and lib directories for various things, but doing that didn’t work for me. I also wanted to compare earlier GCC versions, but couldn’t get 4.6 or 4.4 to build from source on my system either - again, seemingly due to multilib issues.
Comparing compilers fairly is a difficult thing to do as they all have different abilities in terms of optimisations, and even for the built-in standard -O1/-O2/-O3 optimisation types, they do different things for these. However, given the huge amount of different options they have controlling things like inlining aggressiveness and limits, loop unrolling, vectorisation, etc, it would be vastly time consuming to try every compiler option progressively to try and find the best combination for that version of compiler, although that would be the fairest test in terms of benchmarking the fastest code a particular compiler can produce for a specific set of limitations (instruction support, etc). For this reason, I’m going to stick to just comparing each compiler with both -O2 and -O3 with SSE4 support, as these are generally the starting points for using the compiler.
I decided to run three different rendering tests, each one testing slightly different features of Imagine, although there would obviously be a lot of overlap between the tests, and then two synthetic tests: one of image mipmap creation and the other of procedural noise evaluation.
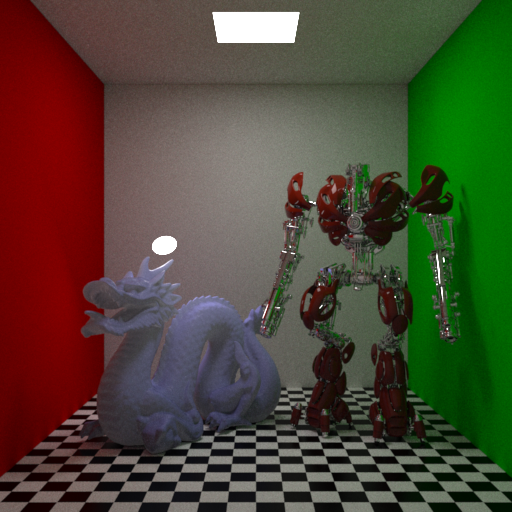
Scene 1 was a fully-enclosed cubic room, but with the front wall plane invisible to camera rays allowing them into the scene. Inside were the Stanford dragon at 1M triangles with a translucent SSS material, and the Katana robot example model with a combination of metal and car paint materials. Two area lights illuminated the scene, a standard ceiling quad and a disc light behind the dragon. This test made use of brute-force multiple-scattering volumetric integration for the SSS, with uni-directional path tracing with MIS, with two light samples taken per direct lighting evaluation. A total of 5 ray bounces were allowed, with a limit for diffuse and glossy of 4, and 5 for reflection rays.
Scene 2 consisted of a large plane with a highly anisotropic metal material with a simple toy train model with diffuse, specular and bump textures and Cook-Torrance-style materials.
There was also a volume primitive backed by dense voxel grids for density and temperature with a (pretty poor) blackbody shader for the emission colour based on the temperature. Trilinear interpolation was used to lookup voxel values. The last object was a toy helicopter with metal and plastic materials, with the rotors animated and quaternion interpolation used for motion blur. An HDR environment light was used. Brute-force multiple-scattering was enabled for the volumetric integration.
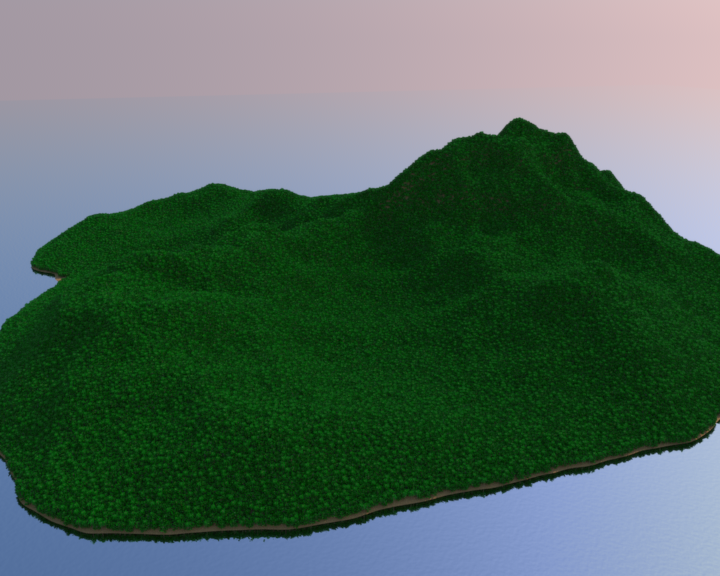
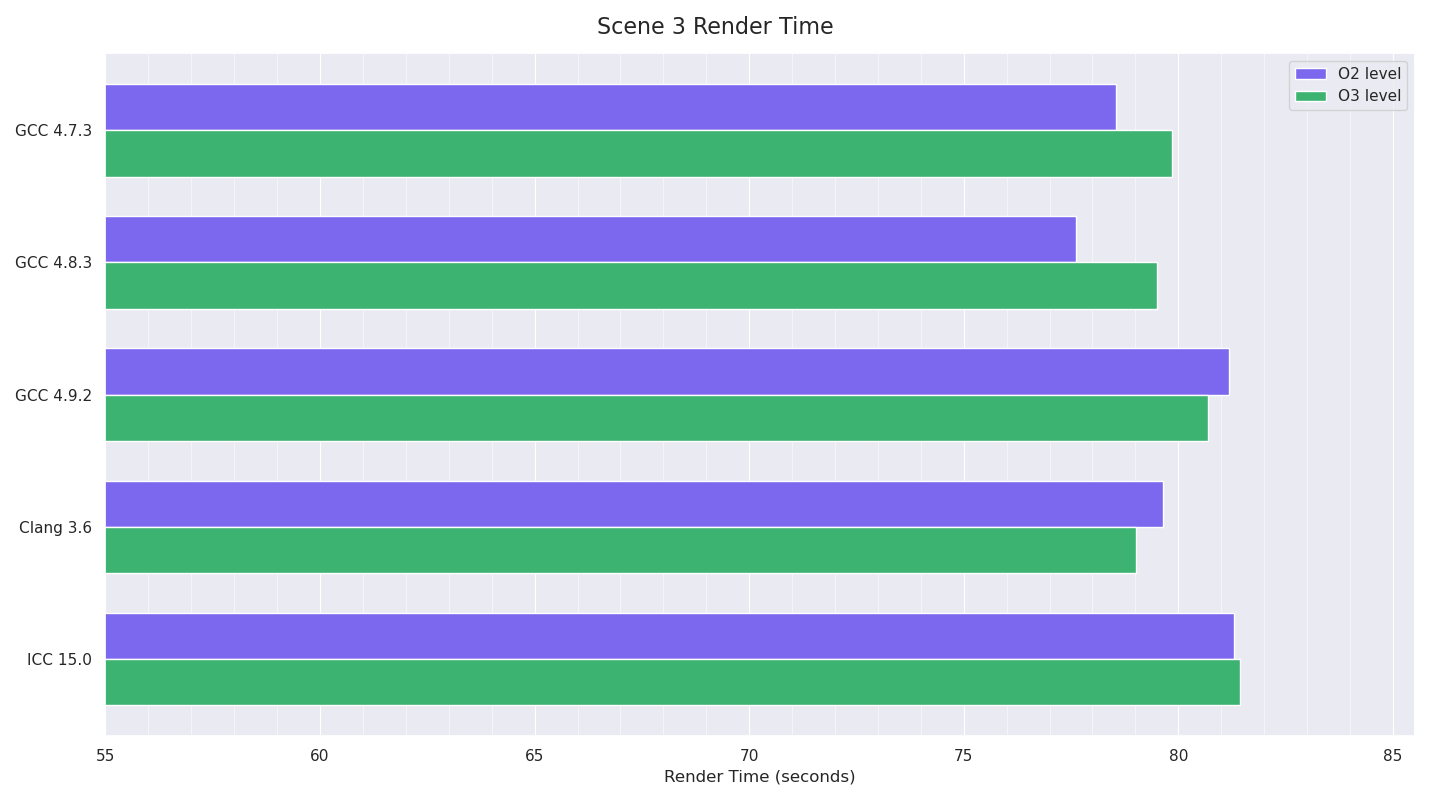
Scene 3 was an extremely large plane with reflective surface and a procedural bump texture, with an island mesh with 165,000 instanced trees on it. The trees had diffuse textures on the trunks as well as procedural bump textures (simplex noise), and the leaves were constant diffuse+backlit+CookTorrance spec, with an alpha texture for cut-outs (using stochastic presence sampling for all ray types). An HDR environment light was used. This was rendered as a Deep Image (alpha), so the integrator needed to do extra work collating and possibly merging each pixel sample for each pixel.
I configured Imagine to use completely deterministic sampling (the random numbers used to generate samples were consistent between runs per thread), and all textures were pre-loaded in memory before starting the renders. Similarly geometry processing and acceleration structure building was done before starting the timers, meaning these rendering tests should be completely deterministic in terms of calculations and would only be memory / CPU bound, essentially testing raytracing intersection, light integration, texture lookups, procedural texture evaluation, etc.
-O<n> -fPIC -fp-model fast -msse4 -no-intel-extensions
(plus some experimental tests I later did with: -O3 -no-prec-div -fp-model fast=2 -xHost -inline-level=2).
My system was a dual-socket Xeon quad (E5-2643), with eight physical cores - 16 threads with hyperthreading (which I made use of for the rendering tests). Linux Kernel version was 3.5.
Timings are mean averages over multiple runs, with the system idle and making sure all CPU core temps were under 45 degC to not bias things by allowing turboboost being used differently between runs.
Results
I did some quick compile timing tests (all using eight jobs only to make sure the build wasn’t IO constrained). Three runs of each from a completely clean build, other than for ICC which kept having FlexLM license errors, so I only had the patience to do two runs for ICC. Mean averages are shown.
To my surprise, Clang was slowest: generally I’d previously found that Clang was much faster at compile time than the other compilers, and other recent benchmarks seem to show that picture as well. Running single-threaded builds of Clang and GCC 4.7 showed similar results: 6 minutes 18 secs and 4 minutes 49 seconds respectively, so I’m not sure what happened here.
(Later Edit: it turned out I had built Clang with asserts enabled, which meant it was doing extra work, and meant the timing numbers for Clang for compile times using it were inaccurate, but all other results here are valid from the build).
For the three render scene tests, Imagine was started, pre-renders were done, I ensured all the CPU core temps were under 45 degC and the system was idle, and then I rendered the scene. Rendering was done with 16 threads (using full hyperthreading of the machine), and each thread had its affinity tied to a unique CPU id (using pthread_setaffinity_np()), hopefully meaning there was less scope for the scheduler to bounce threads around different cores leading to cache misses (in the past I’ve noticed more than measurable speed improvements by doing this especially when the machine has multiple CPU sockets). Timing for just the rendering stage was printed to the console. I ran each test separately, restarting Imagine and doing the pre-renders each time (meaning memory for the images, geometry and acceleration structures would very probably be allocated in different places each time).
I did at least four tests with each compiler / optimisation level combination, often doing more when the variance between the numbers looked odd or too large. I saved the render output of two of each combination for checking later (to ensure they’d rendered the correct thing and to compare final output values).
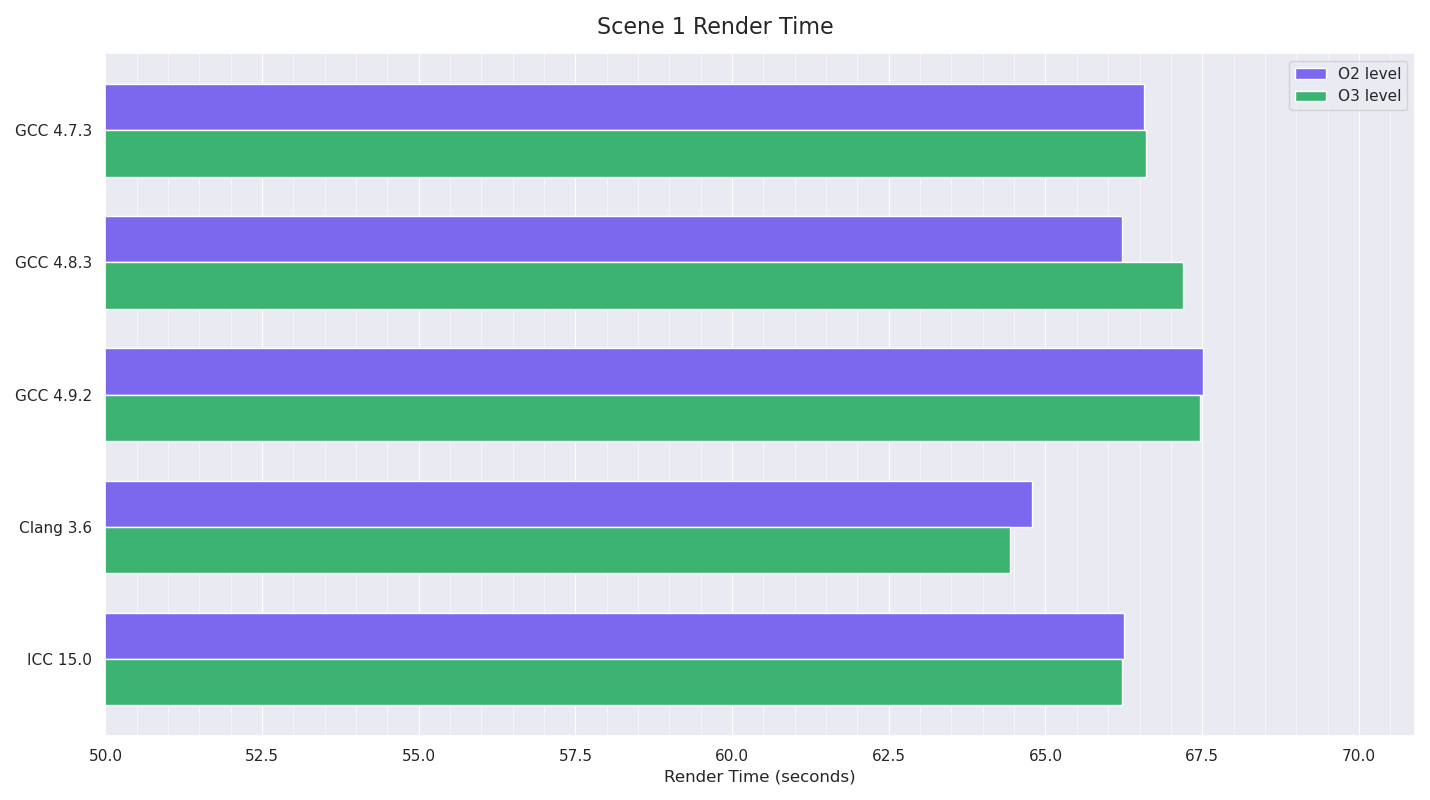
The tests for Scene 1 had Clang as the winner by a fair margin, with GCC 4.9 very slightly slower than the previous GCC versions. Only in Clang’s case was the O3 build noticeably faster than the O2 one.
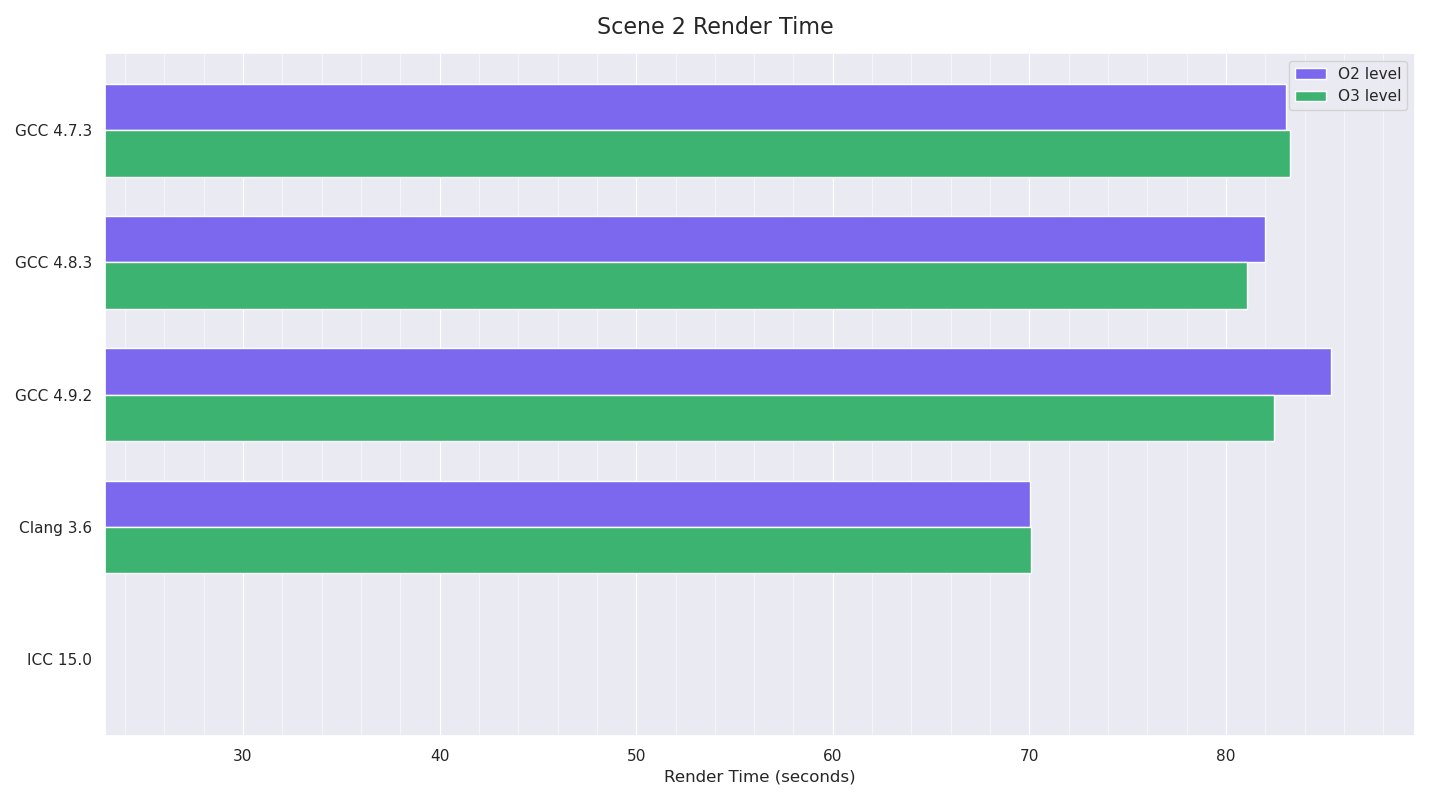
The tests for Scene 2 also seemed to have Clang as the clear winner, although I couldn’t run the Intel ICC tests as there were severe issues with the acceleration structure build code which only triggered in this test (code branches were being taken that shouldn’t have been possible). For the moment I’m putting this down to an ICC bug (given past experience with ICC, unfortunately it is pretty buggy) as marking a uint32_t class member variable as volatile “fixed” the issue, but it definitely seemed that ICC was emitting code that would not copy across all the bits of a uint32_t and so was truncating it, leaving some bits uninitialised. This code was only running when motion-blur was being used for an object (the helicopter’s blades in this case) - basically a special type of primitive clipping that works well with motion blur bounds. I added debug code to verify that none of the other compiler builds were doing things wrong in that place, and as I didn’t want to test ICC with this volatile modification which shouldn’t have been needed, I just skipped it.
GCC 4.9’s results however, showed that the timings were pretty inconsistent: ranging from 88.43 seconds to 82.39. I couldn’t find any pattern to this: the system was idle, CPU temp was down before starting, output results for all the different compilers matched almost exactly (the fast math option was enabled for all compilers, meaning the compilers weren’t required to always stick to IEEE float precision, and thus there were minor variations in the results of some of their calculations, but the differences of the final render outputs were extremely minor), until I discovered that doing successive renders with the GCC 4.9 builds with the same pre-render state gave much more consistent results. Given that all the builds were doing almost exactly the same thing (very minor floating point value differences as pointed out above), this pointed to data memory layout differences causing this, possibly even due to memory alignment issues, but more likely due to differing memory layouts of things like acceleration structure nodes, geometry, etc affecting memory pre-fetching or branch prediction in some way due to the code GCC 4.9 was generating. None of the other compilers showed this issue. The only other difference with the GCC 4.9 tests was that I had to set LD_LIBRARY_PATH to point to the GCC 4.9.2 install’s lib64 directory for a newer version of libstdc++.so.6 in order to run these builds. However I don’t think this was the cause of these timing inconsistencies as I tried running some of the other compiler executables with this modified LD_LIBRARY_PATH (and verified using LD_DEBUG=files output that this newer lib was being used), and the other compiler builds I tested still didn’t exhibit this issue.
Scene 3’s tests are a much more mixed bag with no outright winner, although the O2 builds of GCC 4.7 and 4.8 were the quickest. Again, GCC 4.9 showed varying results, and as before, using the same pre-render state and doing consecutive renders gave much more consistent results (which I didn’t include in these results).
Due to the fact these rendering tests were testing quite a lot of different things at once, and I was slightly concerned about the fact that the ICC builds couldn’t run Scene 2’s test, as well as the fact that ICC wasn’t winning any of the tests (when I last benchmarked the compilers over two years ago, ICC was consistently > 25% faster than the other compilers), I decided to turn my attention to more simple synthetic tests.
For the two synthetic tests, I stubbed Imagine infrastructure code into much smaller separate executables, with code just running in the main thread (still with affinity set).
The Mipmap test involved opening 6 8K 16-bit half RGB scanline OpenEXR files from disk, keeping them in memory (at full 32-bit float precision after conversion) and repeatedly generating filtered mipmaps for these images, 11 times each in rotation (so effectively doing 66 mipmap generations).
I only started timing after the images were loaded off disk and converted to 32-bit float format, so the benchmark should be CPU and memory constrained only (quite a few memory allocations).
In this test Clang and ICC lagged GCC significantly, with GCC 4.9’s O2 benchmark strangely slower than the other GCC timings.
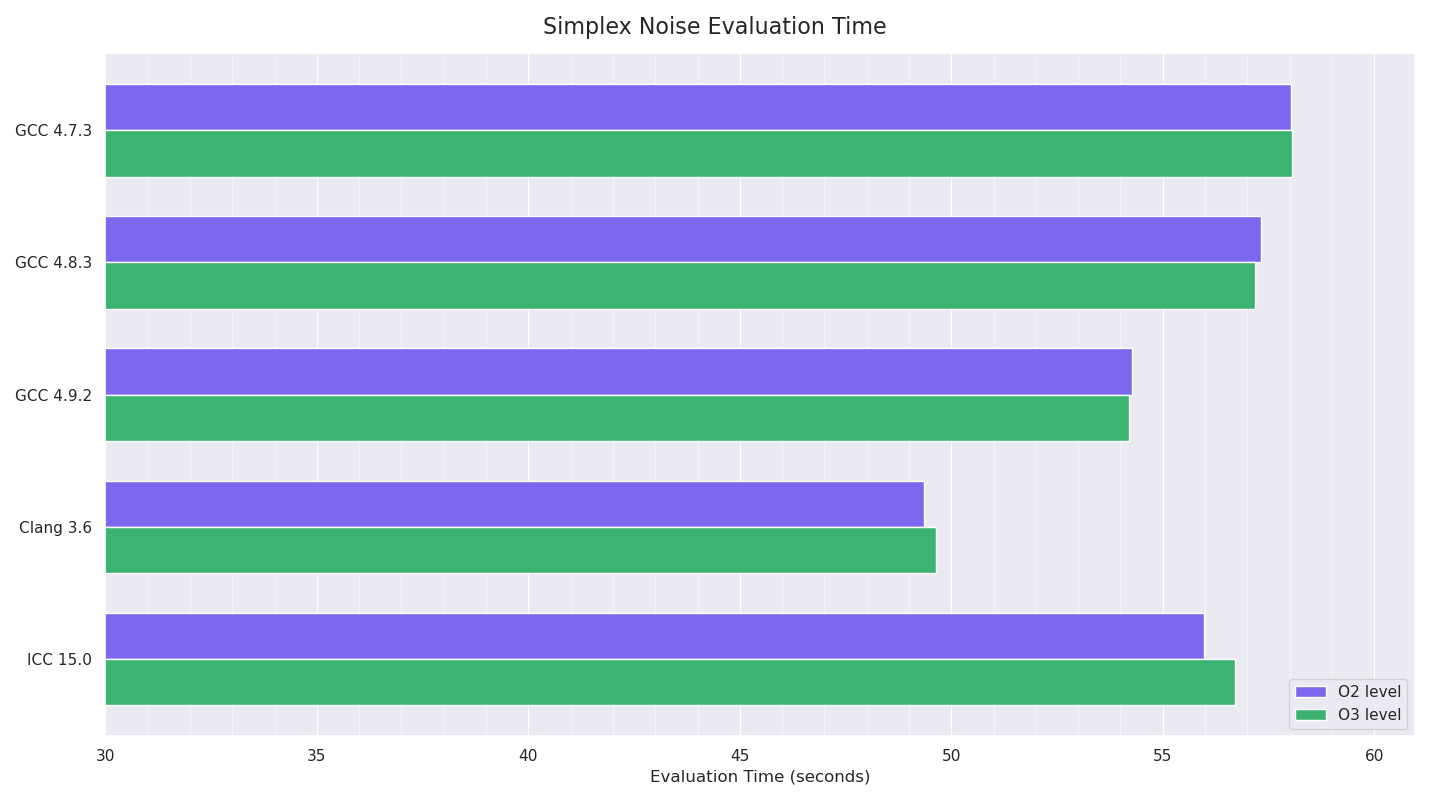
The procedural noise test involved iteratively evaluating 3D simplex noise at regular intervals at positions in the shape of a cube (stepping in each dimension), for a total of 1,194,389,981 evaluations.
I disabled the SSE intrinsics support I had for this code, so it was just pure float / int operations and branching, to see what the compilers could do. This test should be fully CPU-constrained.
Clang won this test by a fair margin, with GCC 4.9 next fastest and ICC followed. I was still really confused by ICC’s poor showing, and started experimenting with more aggressive compiler options: -O3 -no-prec-div -fp-model fast=2 -xHost -inline-level=2
allowing less precision, using all instruction sets the host processor supported and more aggressive inlining at the compiler’s discretion. Doing this knocked a few seconds off the timings for ICC, but I’m almost certain (but didn’t test) doing equivalent things for the other compilers would have done like-wise.
Two years ago, libm’s maths functions (definitely transcendentals like pow(), sin(), etc) were pretty bad in CentOS 4/5 (often to the point that using double precision was significantly faster than the standard float versions), so using ICC meant that it had the ability to replace these functions with Intel’s own optimised ones (which at the time were much faster than libm’s) and statically link them inside the executable. Analysing the symbols in the built executables for ICC and the other compilers showed ICC 15.0 was doing this: most maths symbols for the non-Intel builds were Undefined, with them pointing to GLIBC, whereas ICC’s builds had the symbols in the executable.
So I can only conclude that either GCC and Clang have become much faster over the past couple of years, or libm’s maths functions are a lot faster than they used to be. Both of which I think are probably the case.
I’ll need to do some profiling to work out what’s causing the GCC 4.9 builds to be so inconsistent, as that appears to be why when I first benchmarked with GCC 4.9 it seemed slower.
This isn’t the most comprehensive C++ benchmark, but I think it’s a pretty fair comparison given that the compilers were all limited to a relatively similar degree - while the different compilers do different things at their respective O2/O3 levels, they have the same intent in that they’re recommended starting points, and O3 might be too aggressive in some cases - and taking into account how time-consuming it would be to play around with all the different optimisation flags for the different compilers. I would though have liked to have got GCC 5.0 built from SVN and to also compare the compilers with whole program optimisation, link time optimisation and profile guided optimisation, and to see what benefits those options might have brought over the more standard optimisations.
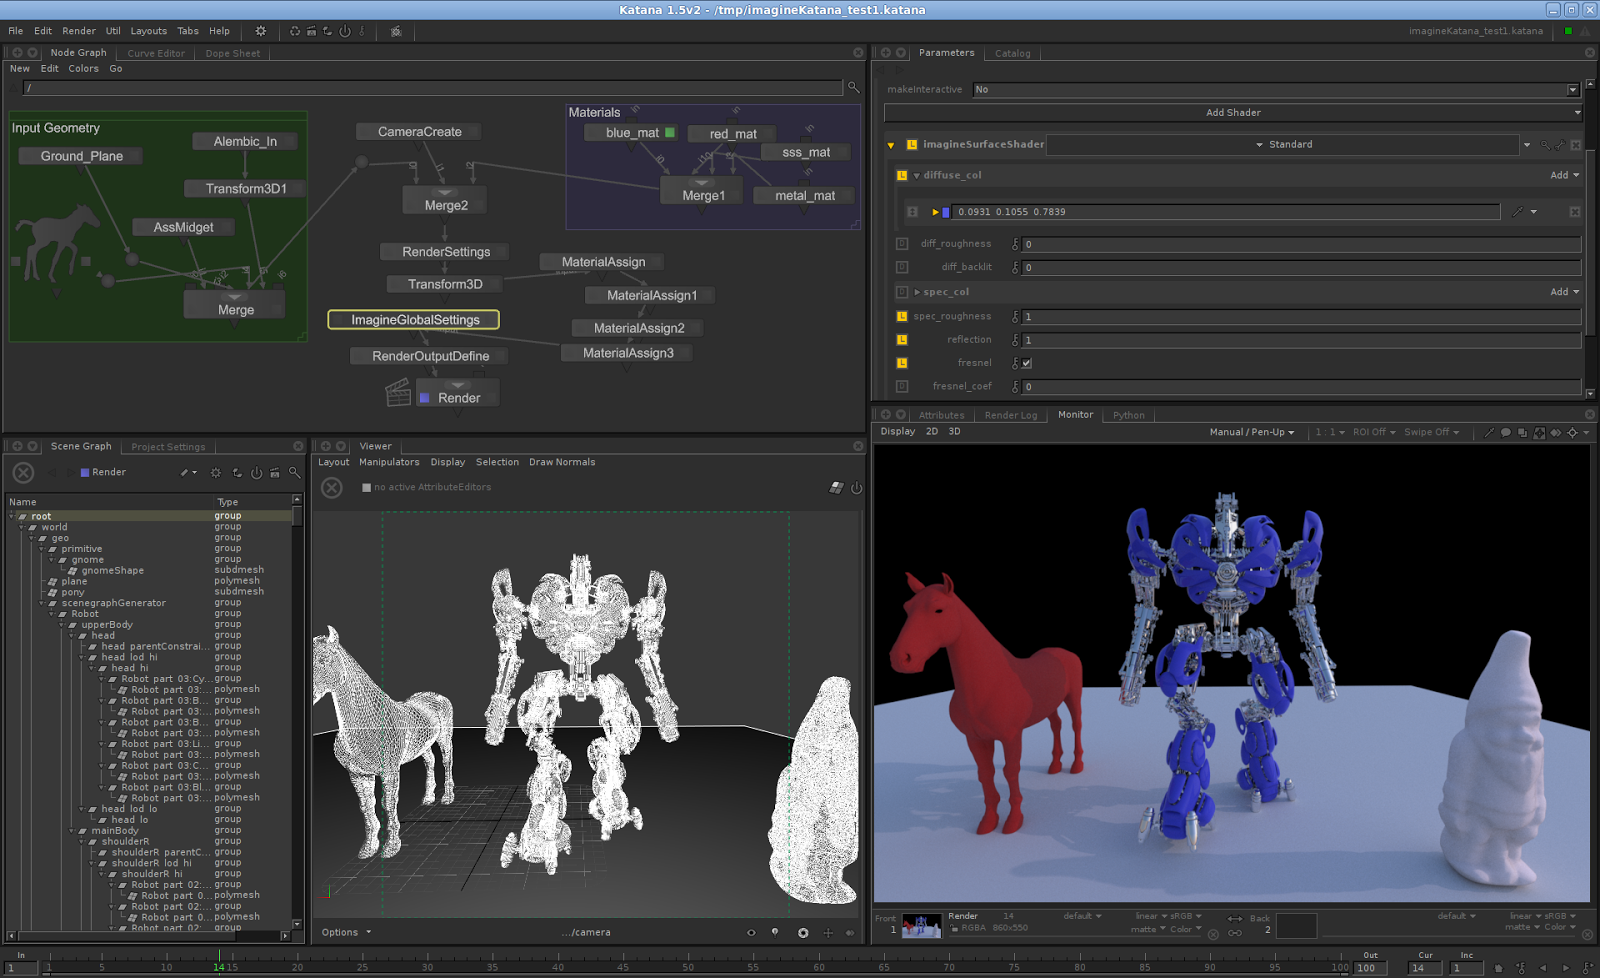
I ended up spending a fair amount of time on the Katana integration in the end, at least in terms of pulling in geometry attributes and static transforms and exposing materials, so that I could pull production scene geometry into Imagine and see how well it coped against the latest versions of PRMan and Arnold. Initially, before I started work on memory efficiency back in June, it was embarrassingly bad, with Imagine using around 9-11 times as much memory, and Imagine only being able to fit around 52 million unique triangles in 24 GB of RAM. In this original state, Imagine was using gathered vertex attributes, so there was a lot of duplication of data.
The first thing I did was to add the ability to use indexed vertex attributes, and this way the source attributes (points, normals, UVs, etc) could be shared among any triangle / vertex in the mesh, with “just” indices being used to index into them. I put “just” in quotes, because vertex indices can also require a lot of memory, especially if the indices for each attribute are different (i.e. points, normals and UVs all have different indices per vertex).
This change reduced memory usage by around 3 times, but it was still not great. I added logic to detect if certain attributes used the same indices (i.e. normals and UVs), and this allowed me to re-use/share indices for multiple attributes if the indices allowed that. The next thing I experimented with was de-duplication of vertex attributes. In a normal closed mesh consisting of quads, the majority of points, normals and UVs are shared by multiple faces, and annoyingly, DCC tools like Maya don’t seem to put much effort into de-duplicating these attributes (other than points) on export (possibly due to the fact that some renderers like PRMan don’t support specifying indexed attributes explicitly at ingestion stage), so UVs and smooth normals values are generally specified up to 2/3 times. Doing this de-duplication (of normals and UVs) added to the startup/build time cost (as well as the peak memory usage), but did reduce overall memory usage quite significantly - sometimes by as much as 40%. However, it came at an additional cost, in that the indices for each vertex attribute would now be totally different and couldn’t be shared, so while the memory usage for the raw vertex attributes themselves was now less, a bigger percentage of the memory usage was now being used by the indices themselves.
Changing the infrastructure to allow indices to be specified as uchar (1 byte), ushort (2 bytes) or uint (4 bytes) depending on the number of attributes of a particular type there were as well as allowing sharing of indices brought more flexibility and efficiency for smaller meshes (but at the unfortunate cost of some rather nasty template type logic in the code), however memory usage was still around 3.5-4.5x more than Arnold and PRMan for the same geometry, and peak memory usage was even higher during build time for de-duplicating normals and UVs.
I had been using 48-byte triangles (on top of the vertex data), based on the fast Shevtsov, Soupikov, Kapustin intersection algorithm which caches several things like base points, edge lengths and overall normal for each triangle, without having to do a lookup into the mesh vertex attributes themselves to do the intersection test - however this was using far too much memory (especially for deformation motion blur), so I added the ability to use several different possible triangle types dynamically per-mesh at build time, with the minimal Moeller-Trumbore algorithm being a new type which only needed 2-4 bytes (depending on number of indices items) of additional storage per triangle for the index into the indices for the triangle (I eventually got this down to 0 bytes extra by passing this index through from the acceleration structure).
This left Imagine using around 1.8-2.5x more memory than the latest versions of the other renderers, which while a significant improvement compared to the starting point, still left room for more. Due to the fact that there seemed to be a balance of memory used for raw geometry attributes vs the memory used for the indices into the attributes, with de-duplicating the attributes requiring a fair bit more memory for the indices themselves, the memory for both needed to be reduced at the same time.
I first investigated bit-packing the indices, but while doing this is fairly trivial when pre-computing / processing them up front (using delta encoding or high-watermark encoding), when completely random access is needed this becomes a lot more difficult. I experimented with hiword/loword encoding of delta differences between the indices for progressive triangles, and storing the indices for two triangles in one set of indices, but due to the variable nature of indices between adjacent values, it was difficult to provide random access without using some sort of keyframe-style encoding which got rather complicated. I realised that when vertex attributes like normals and UVs are fully specified - i.e. duplicates are given for each face, assuming that the attributes are listed in the order the polygon vertices are specified (in other words they aren’t indexed), then it’s possible to only store the base index for that triangle - the other two indices will either be the next sequential numbers (for triangles and the first triangle of a quad), or sequential after a gap of two shifted from the base vertex, with the final vertex being the base one for the second triangle of quads. I stole a bit from the item index to store the triangle type, and this allowed these indices to be worked out by only storing one value for all three indices for a particular vertex attribute. A further optimisation was realising that in certain cases (the mesh consisting fully of triangles or quads, or mostly quads with a very limited number of triangles) you don’t even need to store this base index fully - you can store the offset value after dividing the triangle index by a constant (which needs to be worked out before hand based on the type of mesh), meaning an 8-bit signed char integer can in certain (limited, but fairly common in general use) cases be used to store indices into the millions due to the indices of a polygon being consecutive due to the fact that shared attributes between faces weren’t being de-duplicated, so this base index is explicitly calculable on-the-fly.
These optimisations brought down indices memory usage significantly in the majority of situations, with no noticeable runtime penalty, but they relied on the fact that vertex attributes weren’t being de-duplicated.
So I then turned to trying to quantise non-point vertex attributes (point attributes need to be stored at full float precision due to FP precision requirements for the vast majority of general rendering situations, at least at VFX scale). It turns out there’s been a lot of research in this area, especially for normals, but a lot of it has been done with game engines / real time in mind. I first tried a naive compact representation of normals using spherical coordinates stored at half precision - using a total of 4 bytes instead of 12 bytes. While this brought down memory usage significantly, the accuracy was pretty bad and lossy, with axis-aligned directions not being fully reconstructable (for example 0.0,1.0,0.0 ends up being reconstructed as 0.000484,0.999999,0.000484) which is enough to cause shading issues.
Reading through the research on this subject (starting with Deering’s work in 1995 at Sun) did show that using full float (96 bits) representations was wasteful for normals: that’s accurate enough to shoot rays from the Moon to Mars with centimetre-accuracy on the surface of Mars (I’m assuming the relative positions of the planets makes a huge difference to this comparison!). In general (according to Meyer, Submuth, Subner, et el. in 2010), only 51 bits of floating point accuracy are required.
I tried a few non FP implementations of bit-packing at both 16-bit and 32-bit (because normals are unit length, you can just store two of the values and reconstruct the third): 16-bit is too lossy, but does allow storing axis-aligned directions losslessly, so might be useful for low LOD type situations where smooth normals were still required for some reason. 32-bit seems to work well, although you have to be careful about the distribution of the directions. It is obviously lossy, so comparing a normals AOV between full 96-bit precision and 32-bit packed does show differences, but in fairly comprehensive comparisons of beauty and other light AOV side-by-side renders, and worst-case test scenarios (extremely heavily subdivided sphere with heavy specular highlights, and the same sphere being perfectly reflective and reflecting a high-res checkerboard environment map light rendered at 4k square) and I’ve only spotted barely-perceptible minor differences in this latter test case. There’s a slight (just under 1%) overhead to rendering with 32-bit packed normals, due to three multiplications, one divide and a square-root being required to convert back to a full-precision normal. When using 16-bit packed normals an 8192 item LUT table can be used for the lookup, with no overhead at all. Using a LUT with 32-bit packed normals is unfeasible, as the LUT would need to contain 536M items, which is obviously ridiculous. For the moment I’m happy with this normal encoding, but there are more advanced and variable (in terms of size and precision) encoding methods with greater accuracy I could look into if I find accuracy isn’t good enough in the future. This change reduced normal memory storage down to a third.
Compressing UVs is more difficult, depending on what UV values you want to accept: using half format for each U,V value is acceptable in the range -2.0f - 2.0f, but outside of that, for any texture atlas usage, it’s too lossy, so for standard UDIM ranges (0.0f - 10.0f) just doesn’t work well with obvious stretching and differences, as the half precision just isn’t good enough at the bigger ranges.
In the end, I settled for a slightly hacky, but still generally very usable solution of compressing U,V values into 16 bits each - with a supported range of -10.0f - 10.0f - by just storing a scaled integer value of each value. I could double this accuracy by not allowing a full mirroring of the values below 0.0, but given as MPC’s v values are 1.0f - v, to render production assets I need this ability at least for the v value so I’d need to offset them, but that’s easy enough, and I so far have only noticed very minor artefacts from using this compression method when comparing against full-float UV representation with hero assets with high res (8k tiles, 40+ UDIMs) textures rendered at 4k, so I’m happy with this for the moment. The error losses for each value are currently approximately 0.0002. However, it might be worth investigating a possible modification to ILM’s half format which would have less range (say, -32.0 - 32.0) but more accuracy which might work better as a more generic solution for UVs, as long as the accuracy is there in the core -10.0 - 10.0 range. So this change reduced UV storage by half.
The infrastructure I’ve implemented for the quantisation allows great flexibility, so per mesh I can decide whether to store at full precision or any quantised combination supported by different attribute types.
I also made further memory reduction changes to Imagine’s acceleration structures - instead of storing arrays of pointers to the objects/triangles in the acceleration structure, I’m now storing the actual objects themselves, which saves quite a bit of memory - 8 bytes per triangle / object, which brought total acceleration structure memory usage down by about 30%.
Together, all of these changes have now allowed Imagine to generally use less geometry memory than Arnold 4.2 and PRMan 19 RIS depending on how the geometry is specified. If it is specified as pre-indexed attributes, Image doesn’t do as well, but testing many large-scale production scenes with from 100-300M unique triangles, Imagine is in a much better place memory-wise than it was six months ago, and is definitely very competitive geometry memory-wise and speed-wise against Arnold 4.2 and PRMan 19: Imagine is now able to comfortably render over 500M unique triangles in 24GB of RAM with UVs and per-vertex normals.
I think there’s still more work to be done though on memory usage in general, as Arnold’s claimed acceleration structure sizes in its stats are about 25% lower than Imagine’s (meaning Imagine doesn’t always win at peak memory usage), and PRMan 19’s claimed acceleration structure memory usage is even more impressive: sometimes a fifth of Imagine’s. Assuming these numbers are correct (I trust PRMan’s a lot more than Arnold’s as Arnold’s unaccounted memory usage is around 40% of total usage on average, so it’s possible its acceleration structure usage just isn’t being tracked fully), I’ve still got some work to do on this front: quantising the bboxes for each node and storing references to objects and other leaves more efficiently with relative indices instead of absolute indices allowing each index value to be stored in less bytes.
I did some prototyping of two different shading implementations which allow vastly more flexible shading than Imagine’s previous baked-BSDF approach. The two different methods I tested really only varied in how the memory for the dynamic BSDF components was allocated and used - both methods built the BSDF components after each geometry intersection (for non-shadow rays - in my final implementation it’s also performed when Transparent shadows are enabled), either from constant values or textures. The first test method was using a memory arena to allocate the samples, and the second was allocating the memory on the stack within the integrator loops.
Fairly comprehensive benchmarking - using a worst-case scenario: allocating lots of different BSDFs all driven from image textures, and all controlled by quite convoluted and expensive branching logic - showed that between the two methods, in terms of speed, there was practically no difference. However, there was (as I expected) an overhead to doing this compared to the baked BSDF approach - generally around 4-9% overhead total render time. The extreme end of this I’m putting down to image texture evaluations (all images in the tests were memory-resident, so with texture paging and displacement the overhead could be even higher), and the lower end is probably the additional branching for controlling the BSDF creation now being called for every ray bounce instead of just once. Because of this, and the fact that there didn’t seem to be any overhead in just having the stack based dynamic BSDF components in the integrator loops if I didn’t use them, I decided to use this second approach which allowed me to still use the baked BSDF approach if the material definition was simple enough to allow it. This allows great flexibility but at the cost of some code complexity, but I think that’s a worthwhile trade-off.
So now any float/Col3f material parameter can be driven by textures, and a decision is made per-material at pre-render time whether complex shading is needed on a per-material basis. If not, the material will pre-bake the BSDF as previously, and within the integrators, this baked BSDF is returned by the material shade() function and used.
If complex shading is needed, then the material can make use of the pointer to the stack-allocated BSDF memory which is passed in to the shade() function, allocate BSDF components as required using this memory and then return this pointer to the integrators. The base infrastructure is now in place for node-based shading networks - the GUI side of things for that is the main work required to complete this.
Based on this new functionality, I implemented a MixMaterial ability to mix or binary-switch materials based on a texture.
I also added UDIM texture atlas support with lazy on-demand reading of textures based on the UV coordinates.
Since the last update, I’ve thoroughly refactored Imagine’s image texture and file-reading infrastructure to now support Image textures at native bit depths (except for 16-bit uint support) instead of always converting them to floats as I did previously. I’ve basically reversed the way image loading and texture creation work - previously, image textures were always full float and the image classes were filled by the file readers - now, image classes are created at the most suitable or requested bit depth and interpretation (for single channel images) by the file readers, and suitable image texture classes are created based on these resultant images, which then do any relevant conversion in the texture lookup to return full float values for the integrators / BSDFs: for 8-bit uchar textures, a LUT is used to convert and linearise the values, so speed is not an issue, but for half float, casts have to be done, and unfortunately there’s a small (but noticeable) overhead here, despite twice as many fitting into cachelines. I’ve tried doing any filtering / interpolation for the lookup before converting to full float, and then converting only a single half to a float afterwards, and this helps, but this isn’t possible for HDR images used for environment lighting as the values are often quite high and can be near the limit of half, meaning you can’t average them at that precision. But regardless, this change brings a huge reduction in memory allocation for textures, and it’d now be fairly easy to add texture paging to my texture caching infrastructure.
I’ve also finally made my DistributedPath integrator usable - I’ve been trying to duplicate how Arnold splits diffuse and glossy ray bounces for over a year now, and thanks to some diagrams in its documentation, it looked like they branch at every bounce, which was how I wrote my integrator. Doing this however resulted in a stupid amount of final rays that was ridiculously slow, and also made generating decent samples very difficult and expensive (pre-generating and re-using might have been an option). After playing with Arnold over the last six months and benchmarking it with various sample and depth settings, I’m very certain now that it only splits rays on the first bounce. So with this modification, my DistributedPath integrator is now very usable, and for scenes where geometry aliasing isn’t an issue and no depth-of-field or motion blur is required, can speed up rendering to a particular noise level fairly significantly compared to pure path tracing: it’s helpful when there’s lots of indirect illumination, where the diffuse split multiplier can really help to reduce noise. However, you generally need to increase the number of light samples as well to compensate for the reduced number of camera samples sent out.
I’m currently in the middle of implementing a new and much more flexible shading system - Imagine’s current one is pretty limited and basic, and basically just bakes down BSDF components to a container BSDF at render start, which is then always fixed for that material. This works very well (in terms of shading speed) for simple shading and non-varying mixes of materials, but makes more complex mixes and blends which are controlled by textures very difficult to code, sample and control, and also makes medium IOR transitions very complicated. I’m prototyping two different methods here to see what the overheads / limitations of each are.
In terms of future work, the task after the shading change is to seriously reduce Imagine’s geometry memory footprint, in order to make it more competitive with other renderers. Thanks to Imagine’s origin as a sandbox for learning OpenGL and 3D programming, its native GeometryInstance representation is very inefficient for source geometry, and the baked geometry (tessellated version of source geometry) representation is also pretty inefficient, due to OpenGL’s requirement that you can only access vertex attributes uniformly, so triangle points, normals and uvs pretty much need to be gathered, leading to up to three times as many points, normals and uvs than the source geometry has. I’ve had a TriangleGeometryInstance for a while, which I used in order to be able to load the Lucy Stanford model on my laptop which stores pure triangles very efficiently (and doesn’t do any OpenGL drawing), but I need to support polygons and Sub-ds correctly efficiently, so quite a bit of work is needed. I’d also like to look into changing the indexing size for geometry, so that for meshes with less than 65,535 vertices, I can index them with ushorts, instead of wasting space using uints - for low LOD representations of geometry, this might be quite useful.
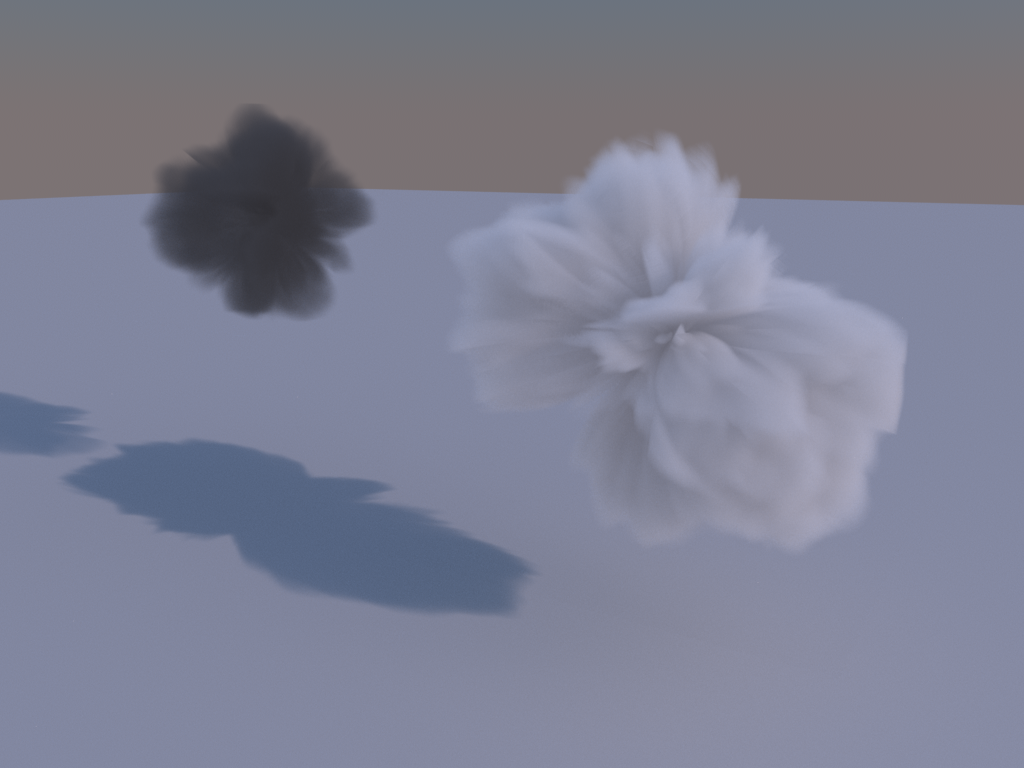
I’ve spent a bit more time both getting some decent volumetrics source data (via Mantaflow for the fluid simulations and better self-created procedural clouds for the images below) and improving Imagine’s Volumetrics rendering capabilities.
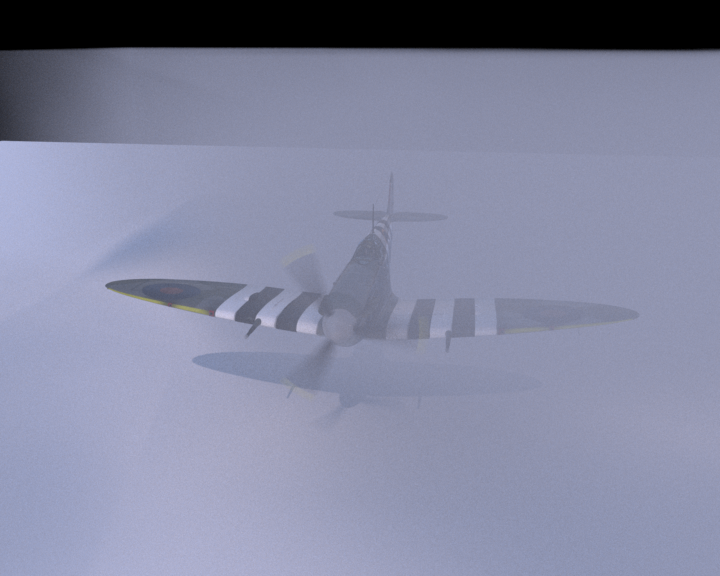
Below are two animations rendered of smoke fluid simulations:
I’ve added importance sampling (not MIS yet - currently there’s a separate integrator for anything with volumetrics in it) of mediums, so noise is reduced a bit, and I’ve optimised several things - calculating the transmission integration through the medium for lighting is now done with double the step distance than Camera and other GI rays use (I could probably do the same for diffuse GI rays in the future), and I’ve added data window extents to my voxelbuffer format, both of which together give significant speedups (the latter especially with trilinear filtering and sparse volume extent).
I’ve also added initial emission support, but the results are currently pretty noisy.
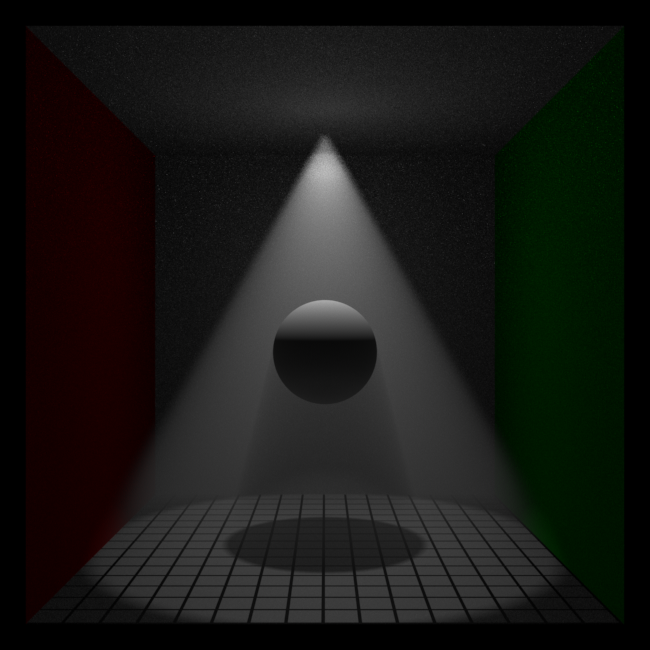
I’ve now got scene-wide homogeneous single-scattering and multiple-scattering of heterogeneous volumes rendering in Imagine.
I’m not doing importance sampling yet, so there’s room for improvement there, and I’m not taking possible emission into account yet - when I do this I might try and get a black body shader working for the emission values.
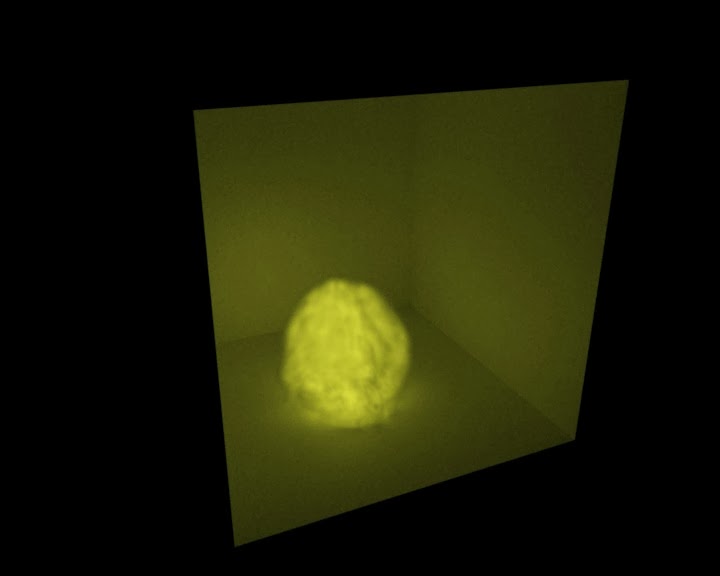
The above image is a procedural pyroclastic cloud - for the moment I’m not going to spend too much time modelling volumes, as that’s quite a task in itself, but I’ve implemented a dense grid and at some point, I’ll try and implement a sparse grid for better memory-efficiency and storage. I could have used Field3D’s versions, but the dense version is trivially simple anyway, and ignoring memory limits and paging in the sparse version, I don’t foresee that being that difficult either, plus the dependency on HDF5 is more trouble than it’s worth.
I was tempted to try to get OpenVDB integrated, but the Boost and Intel TBB dependencies put me off for the moment, but it seems a nice solution.
Above is a bound single-scattering medium in a Cornell Box, with the cliché spotlight.
For scene-wide mediums, there’s an interesting limitation which in hindsight is obvious, but I hadn’t thought of before: image-based (or environment) lighting doesn’t really work. It definitely doesn’t work when you set the light distance to infinity or large values, and while it’s usable to a limited extent at much closer values, it’s not really practical. So I’m not really sure how useful scene-wide mediums are in practice - in production, they seem to be mainly used for god-rays anyway, so…
I’ve implemented Curve primitive ray intersection in Imagine based off Koji Nakamaru and Yoshio Ohno’s 2002 paper “Ray Tracing For Curves Primitive”. Basically, it involves projecting each curve’s ControlPoint positions into orthographic ray-space, so that the main intersection test can be done as a curve width test in two dimensions down the ray, and then the depth t-test can be worked out.
For straight curve primitives, this is sufficient, but for actual curves with any curvature down the length, splitting the projected curve recursively and performing the intersection test on these split curves is necessary. The recursion level needed to ensure accurate intersection depends on the curvature of each curve.
This recursive splitting obviously has an effect on the performance of the algorithm, so while intersecting straight curves is fairly fast, for a curve that curves gently at around 45 degrees from the root to the tip, a recursive splitting depth of six is needed, which results in 32 recursive splits, and a total of 64 intersections on both the original curve and the recursively split curves.
Which is unfortunate, as to some extent it makes rendering non-straight curves unpractical for reasonable levels (+100,000) of curves.
For the moment, I’m setting the resultant geometric and shader normals from any intersection as facing back along the original camera ray, so that the normal always faces the camera. This is sufficient for very thin curves.
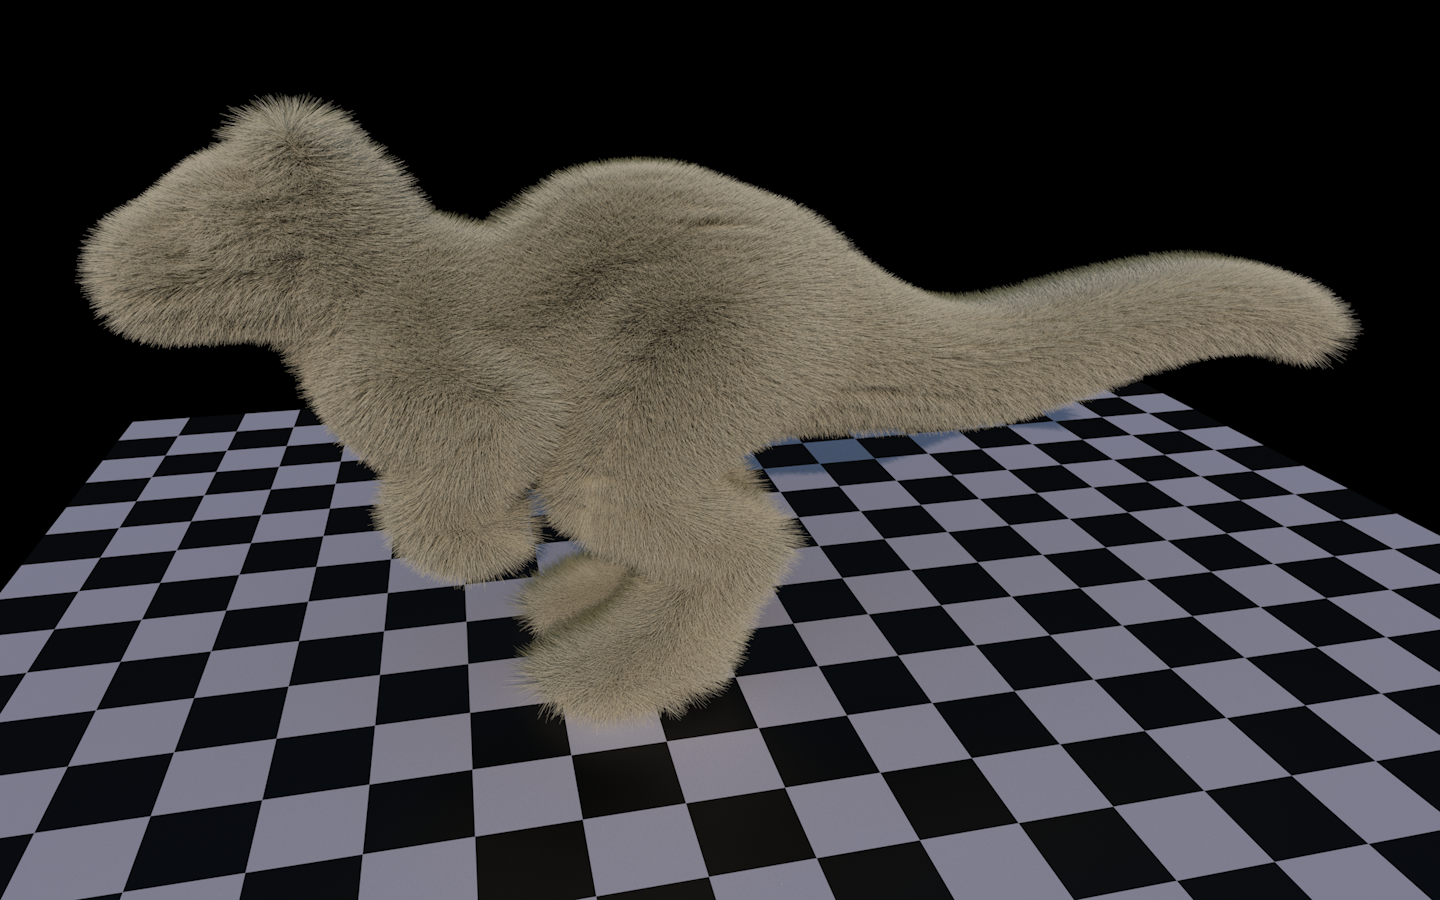
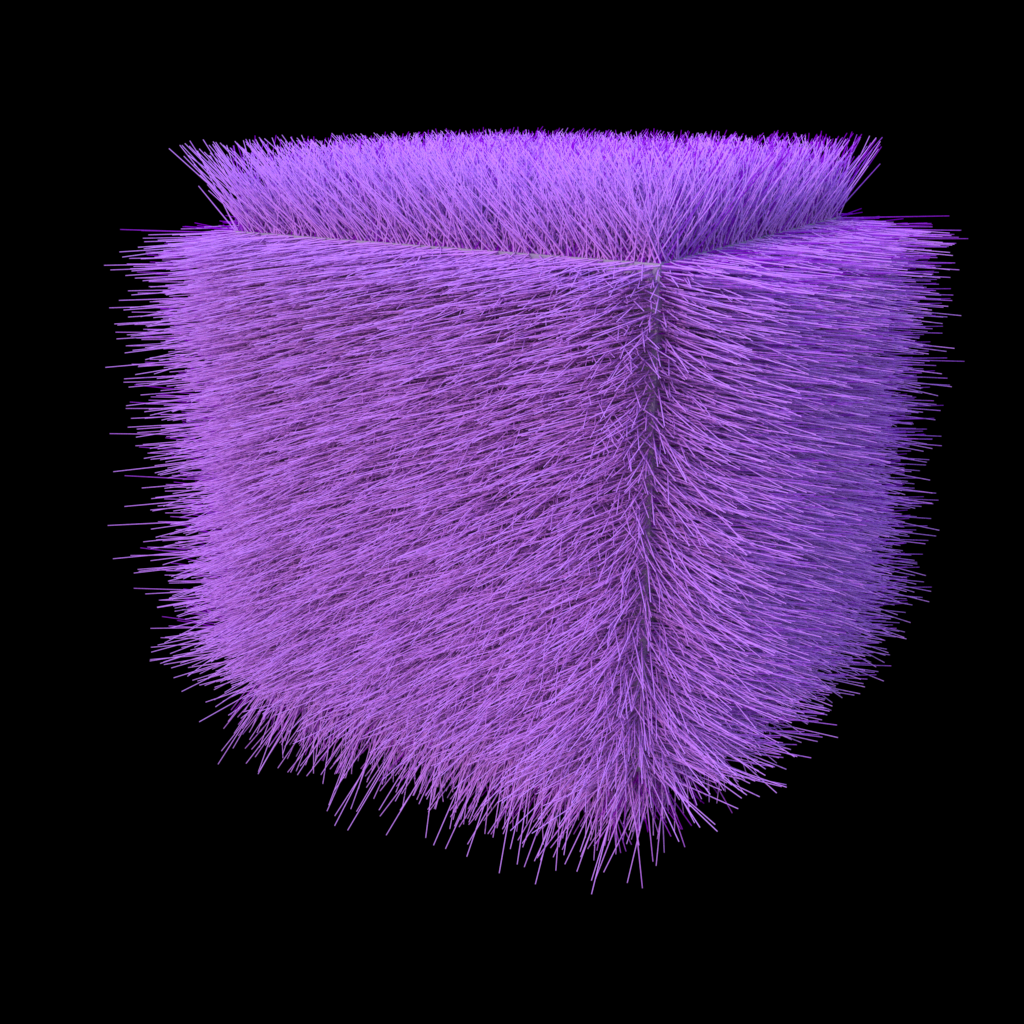
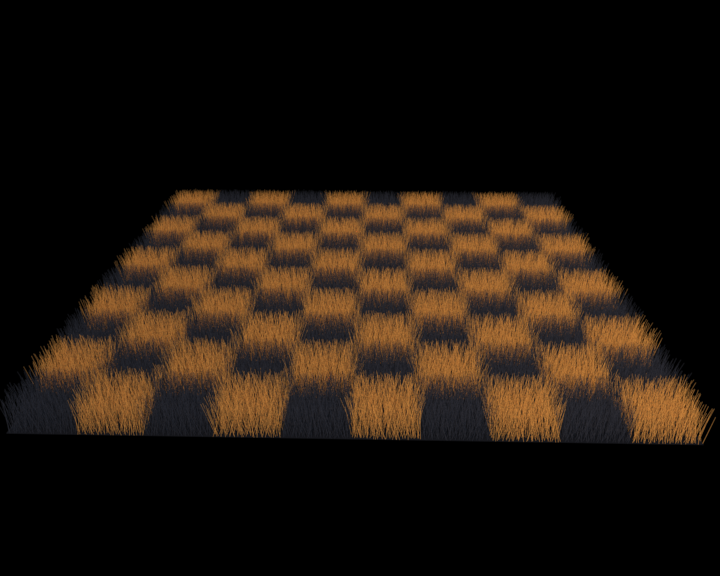
I’ve also implemented a set of Hair BSDFs for Diffuse and Specular, based on the 1989 Kajiya and Kay paper, which is commonly used. This is optimised for very thin curves, with no effective normal change across the curve, but with a tangent value which can be calculated from the intersection position on the ray.
For the moment, I’m storing curves in an acceleration structure, which works well for very short curves or longer curves which are axis-aligned, but for anything else (long curves going diagonally across dimensions) is bordering on ineffectual, as the resulting axis-aligned boundary boxes for each curve are extraordinarily large, with multiple curves often overlapping each other. I had hoped that spatial partitioning (with curve clipping to boundary boxes) would improve this considerably (it’s fairly useful for triangles), but the improvement for using curve clipping with spatial partitioning is not anywhere near as good as I would have hoped (it provides a slight intersection speedup though compared to object partitioning).
So for longer hairs, I’m going to have to think about how to speed this up considerably, as currently rendering long curved curves is orders of magnitude more expensive than I would have liked. It’s also going to either involve work to model and simulate hair strand interaction more, or import curves from elsewhere, as the method of generating hairs around meshes (importance sampling positions on each triangle for the root positions) and giving a random tilt or curve only really works with fur-type curves.
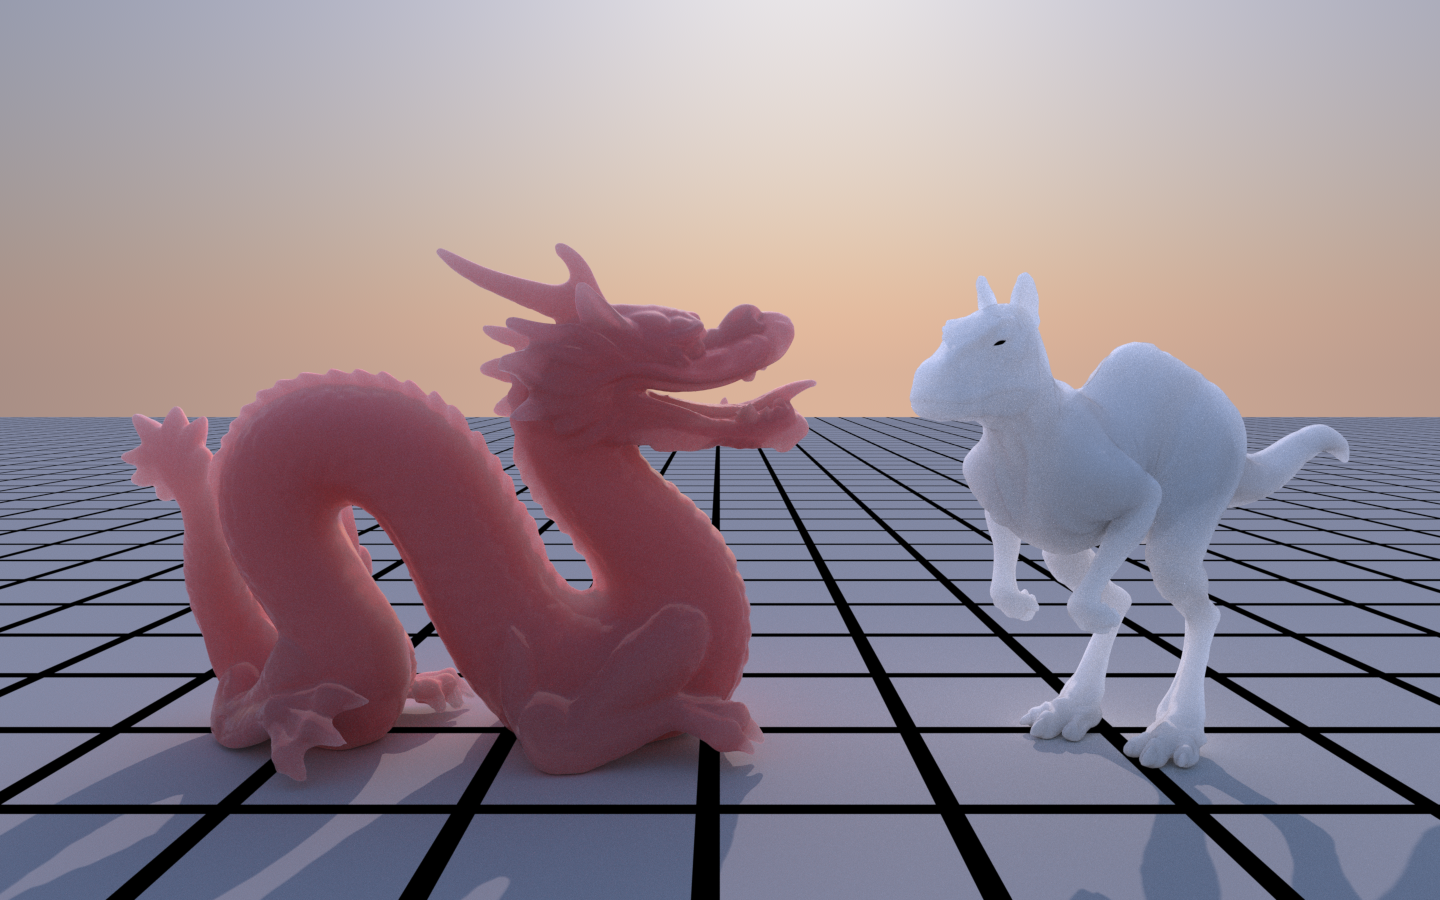
I’ve created a translucent material type for Imagine which allows a more artist-friendly way of specifying the colour and transparency of translucent objects, without having to work out the very unintuitive (until you understand what’s going on internally) absorption and scattering coefficients that control the medium interaction for scattering events and the resulting transmission.
I’m pretty certain it’s not physically-accurate, but it seems to give pretty pleasing results, although I’m still not convinced of the correctness of my implementation, as it’s very easy to produce extremely noisy results.
I got a copy of Volume Rendering for Production for Christmas, so I’m going to be looking into heterogeneous volumes in the future.