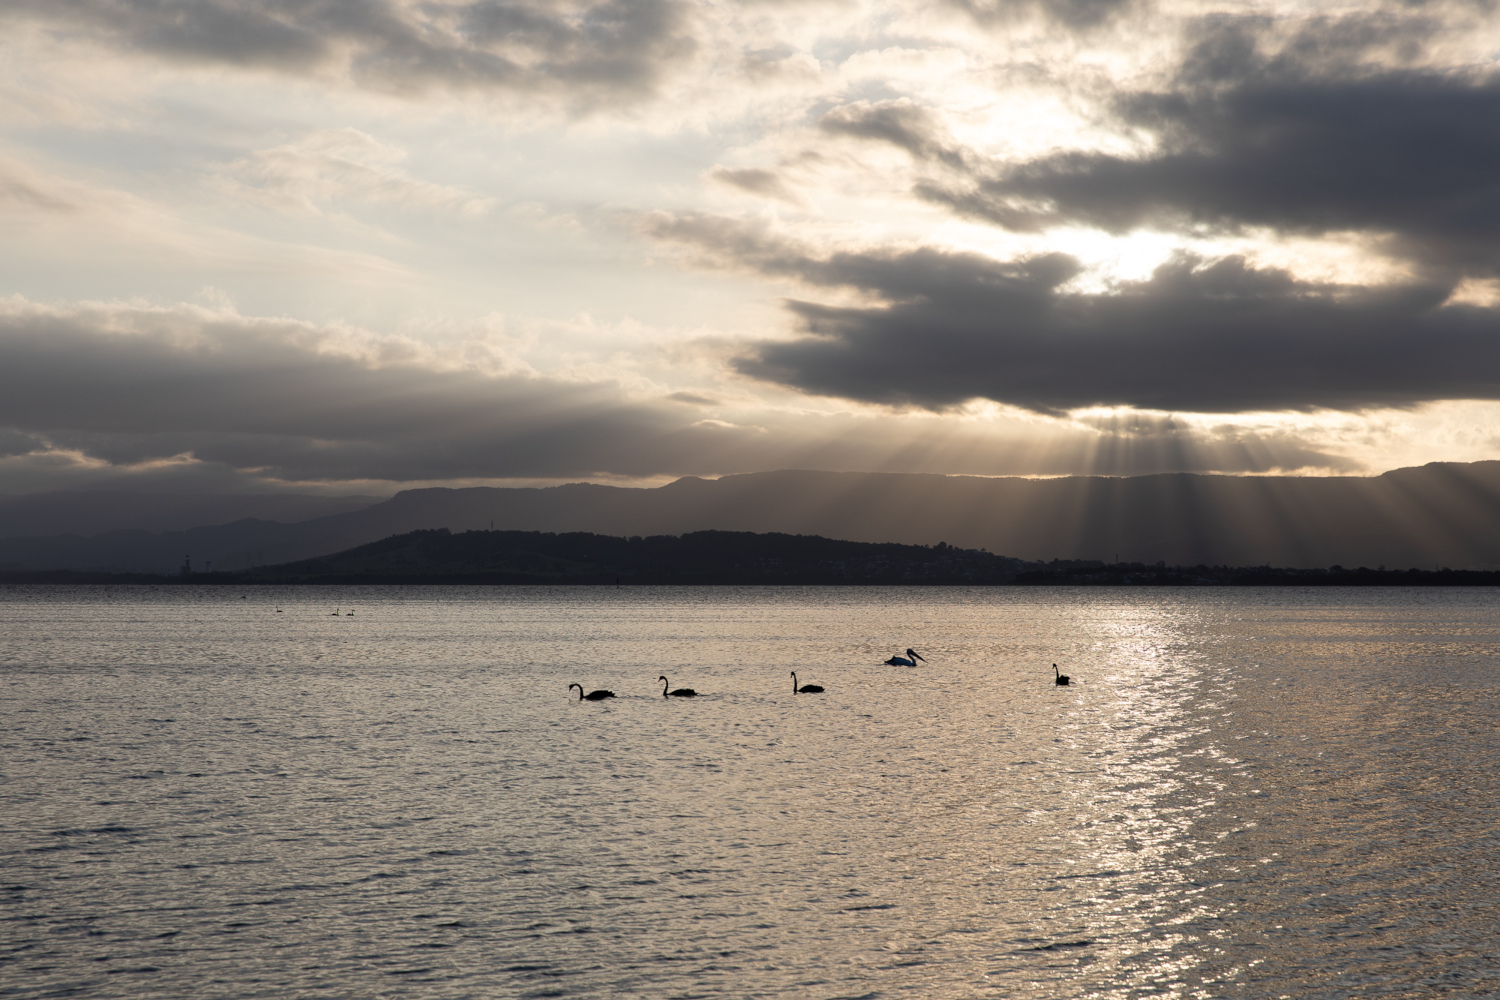
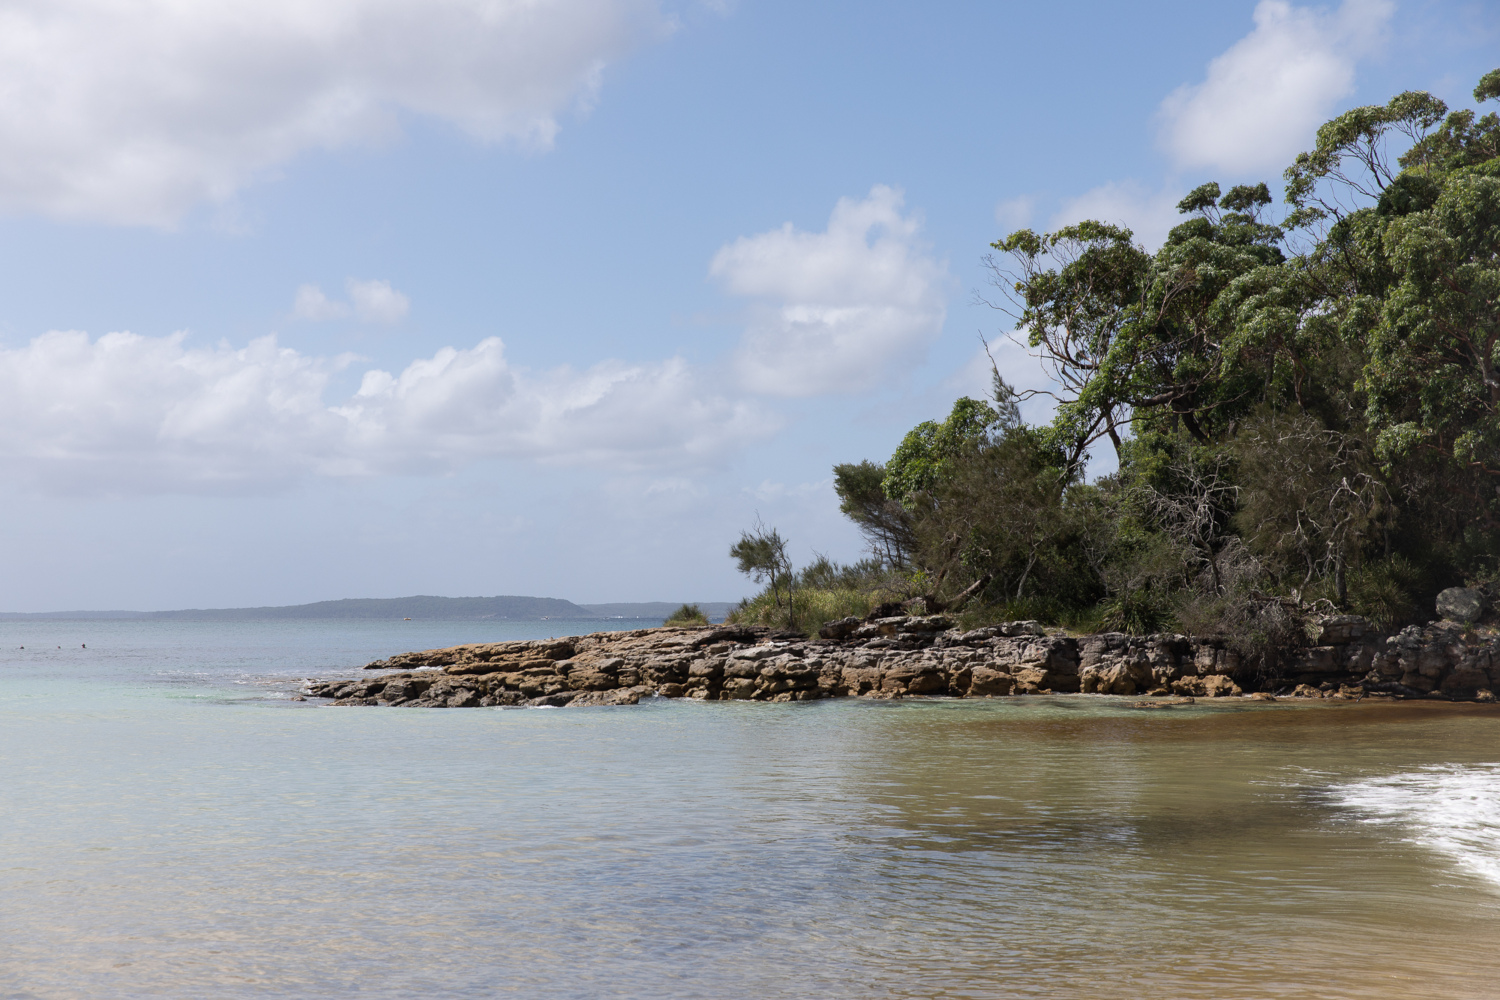
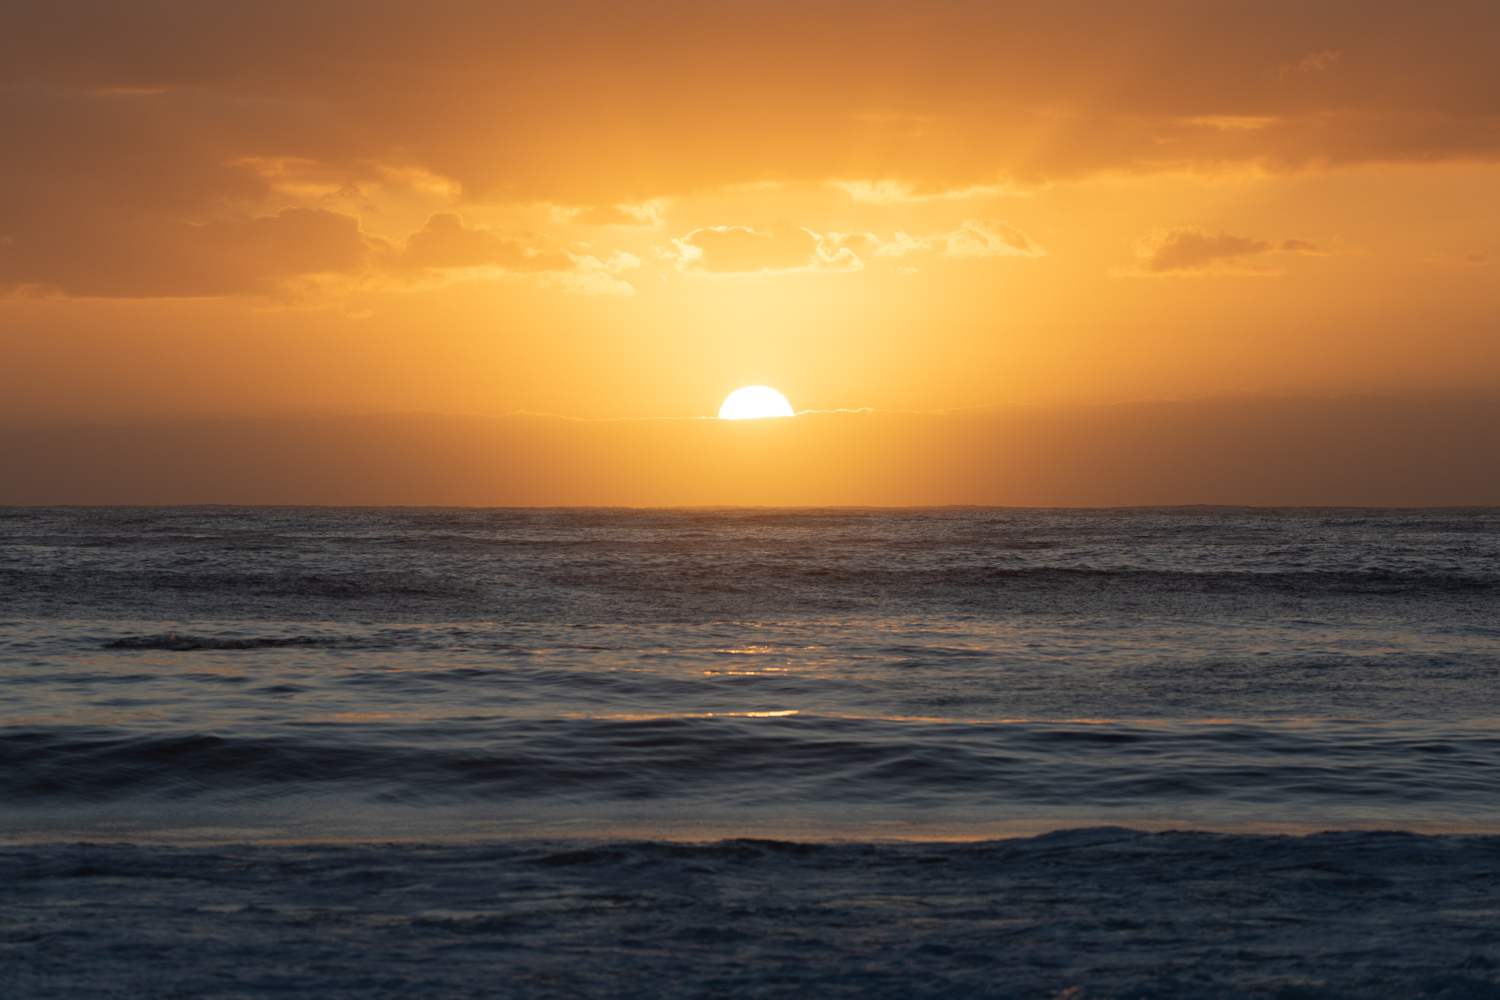
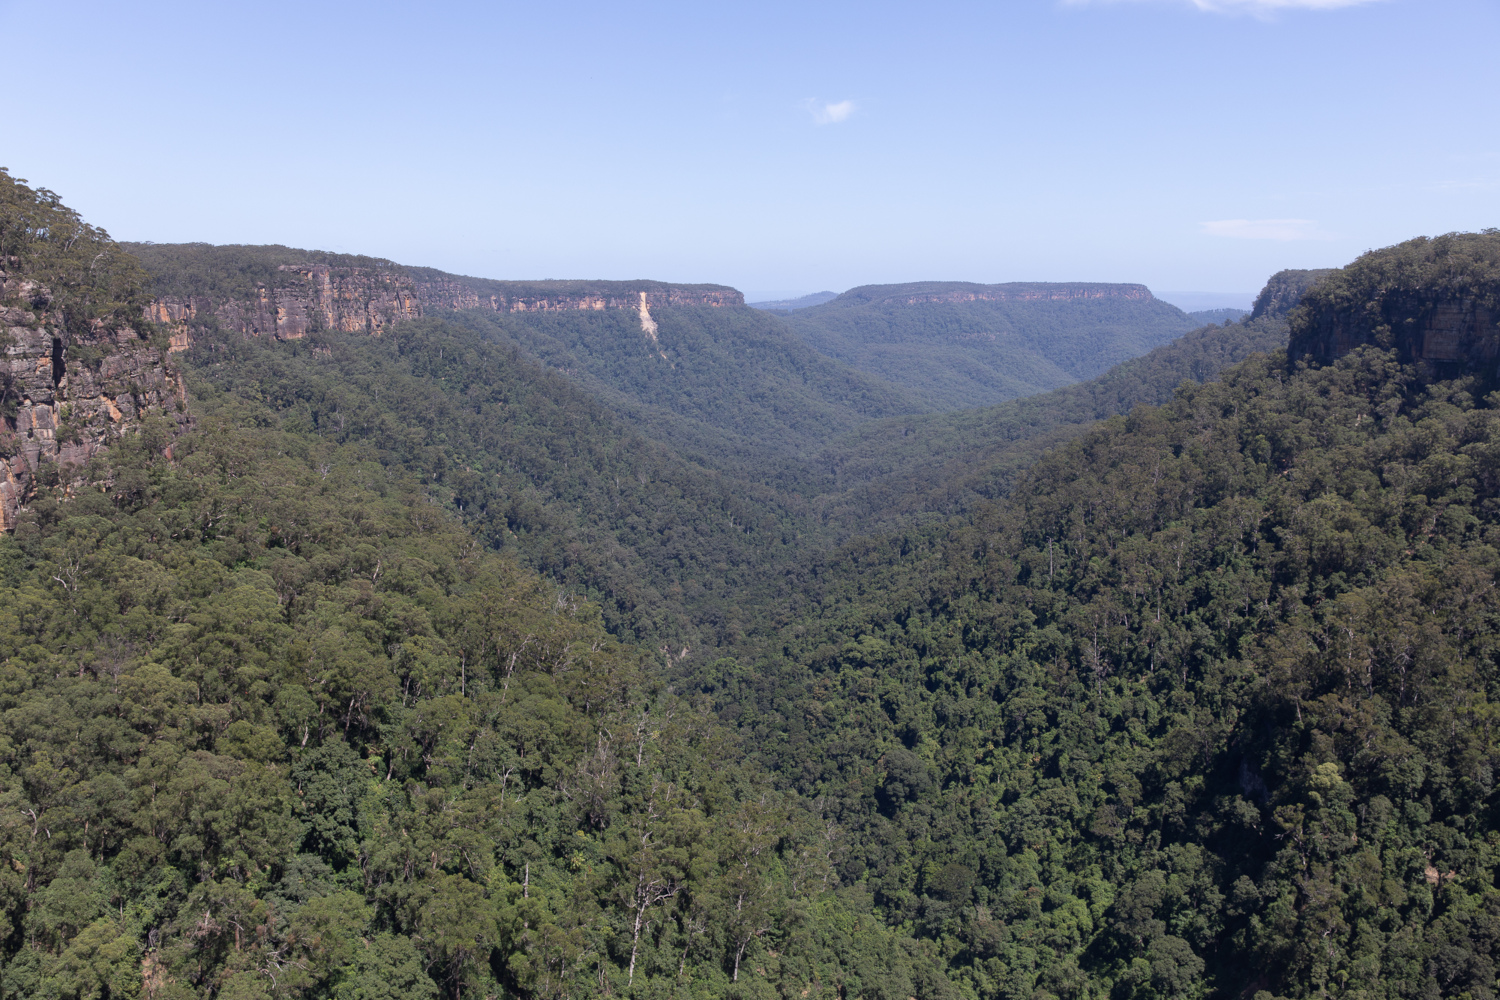
A week ago I returned from a week’s trip to central New South Wales in Australia, driving from Sydney down to (almost!) Batemans Bay, then up again to Newcastle and then back to Sydney.
The aim was to spend a bit more time exploring places I’d skipped / missed when I motored through quickly on my trips passing through NSW in 2018 and 2019 - which I did end up doing, however it turned out I’d forgotten I had actually visited some places before! Jervis Bay Territory in particular - although this time around it wasn’t overcast, so I was able to see it (and the white sand beaches) with the sun out.
The weather was excellent, and once again I got some photos I’m pleased with.
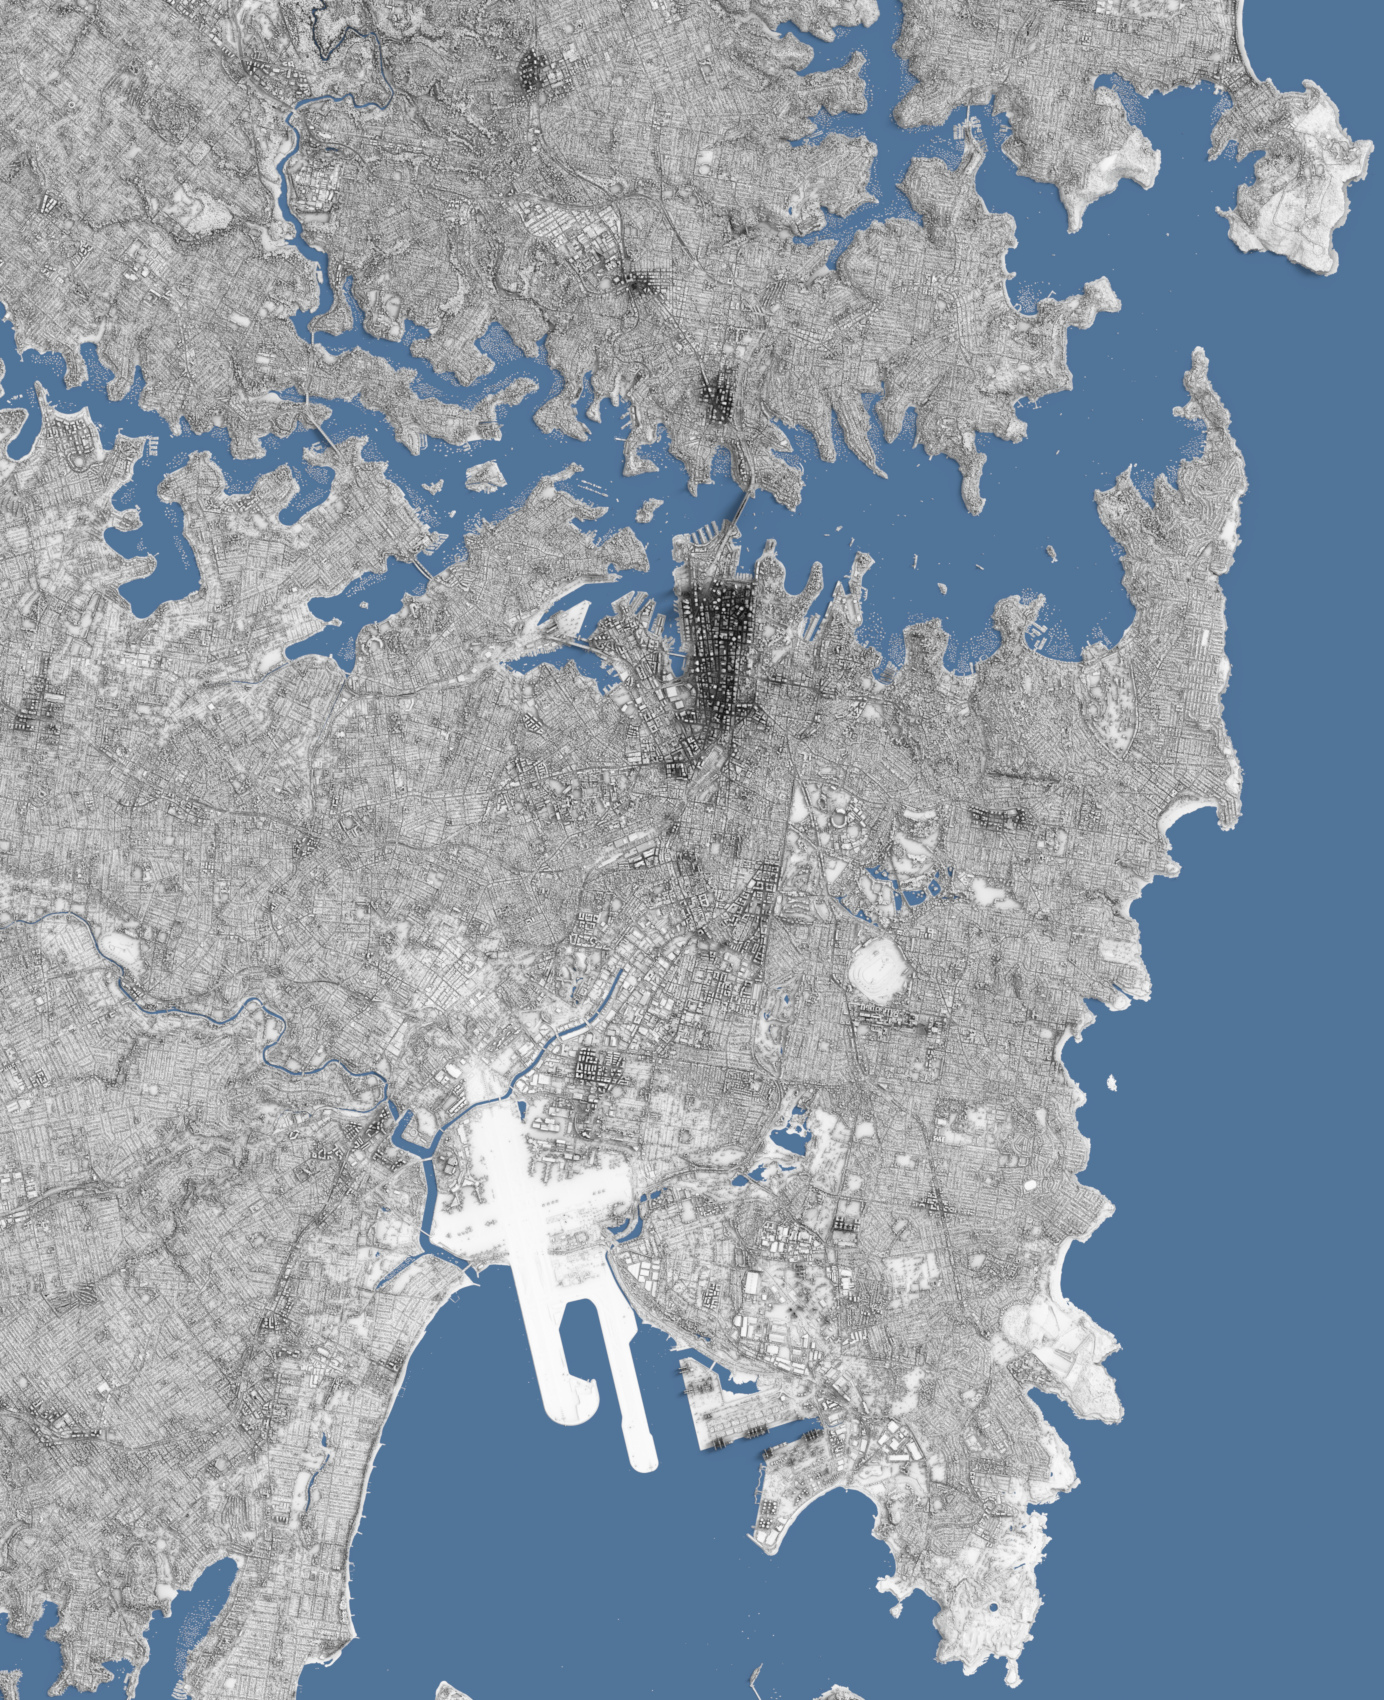
For some of the more recent LIDAR maps I’ve been producing over the past six months - see this post with initial experimentation, and the resulting full-sized maps I’ve rendered so far can be found here - the source data has been in Pointcloud form rather than as a ‘flat’ raster image format (GeoTIFF) of just the DSM height values, and so it requires different processing in order to clean it up, and then convert it into a ‘displacement’ image map so I can render it as a 3D geometry mesh.
The below rendering is of Sydney, and uses a conversion from Pointcloud source data (available from https://elevation.fsdf.org.au/ as .laz files):
The data being in Pointcloud format has both advantages and disadvantages over more simple raster height images: one of the main advantages is that there’s often (depending on the density and distribution of the points) more data per 2D area measure of ground, and each point has separate positions and attributes, rather than just being an average height value for the pixel as it is in raster image format. This means that theoretically it’s easier to “clean up” the data and remove “bad” points without destroying surrounding data. Another advantage is that being fully-3D, it’s possible to view the points from any direction, which is very useful when visualising and when looking for outliers and other “bad” points.
The disadvantages are that the data is generally a lot heavier and takes up more memory when processing it - three 8-byte double/f64 values need to be stored for the XYZ co-ordinates - at least when read from LAS files, as well as additional metadata per point (although there are ways to losslessly compress the memory usage a bit) - in addition to needing different tools to process than with raster images. Newer QGIS versions do now support opening and viewing .LAS/.LAZ Pointclouds (both in 2D and 3D views), although on Linux I’ve found the 3D view quite unstable, and other than being able to select points to view the classification, there’s not much else you can do to process the points, other than some generic processing which uses the PDAL tooling under-the-hood. It also appears QGIS has to convert the .LAS/.LAZ formats to an intermediate format first, which slows down iteration time when using other processing tooling side-by-side.
PDAL is a library for translating and manipulating Pointcloud data (similar to GDAL for raster data / GeoTIFFs, which QGIS uses for a lot of raster and vector operations under-the-hood), and it has quite a few useful features including merging Pointclouds (a lot of the source DSM Pointcloud data is only available as tiles of areas, and so the data needs to be merged to render entire cities, either before converting to a raster displacement map or after), filtering points, rejecting outliers and converting to raster image heightfields.
I have however found its memory usage somewhat ‘excessive’ for some operations, in addition to being slow (despite the fact it’s written in C++).
Because of this - and also to learn more about Pointclouds and the file formats - I’ve started to write my own basic Pointcloud processing utility application (in Rust - the las-rs crate allowed out-of-the-box reading and writing of the .LAS/.LAZ Pointcloud formats which was very useful to get started quickly), which despite not really doing anything especially ‘fancy’ for some of the more simple operations like merging .LAS/.LAZ files - it just does a naive loop over all input files, filtering the points within based on configured filters and then accumulating and saving them to the output file - uses a lot less memory than PDAL does, and is quite a bit faster, so I’ve been able to process larger chunks of data with my own tooling and with faster iteration time.
The one area I haven’t tackled yet and am still using PDAL for is conversion to output raster image (GeoTIFF) - which I then use as the displacement map in my renders - however I hope to implement this rasterisation functionality myself at some point.
I am on the lookout for better Pointcloud visualisation software (in particular on Linux - a lot of the commercial software seems to be Windows or Mac only). QGIS’ functionality is adequate but not great, and is fairly lacking in terms of selection, and other open source software I’ve found like CloudCompare seem a bit unstable (at least when compiling from source on Linux), and it’s not clear how well it’d scale to displaying hundreds of millions of points at once.
I have found displaz which is pretty good for displaying very large Pointclouds (it progressively draws them, and seems to store them efficiently in memory), however it has no support for selection or manipulation of points (by design), so I’m still looking for something which caters to that additional need: in particular the selecting of outlier points interactively and culling them.
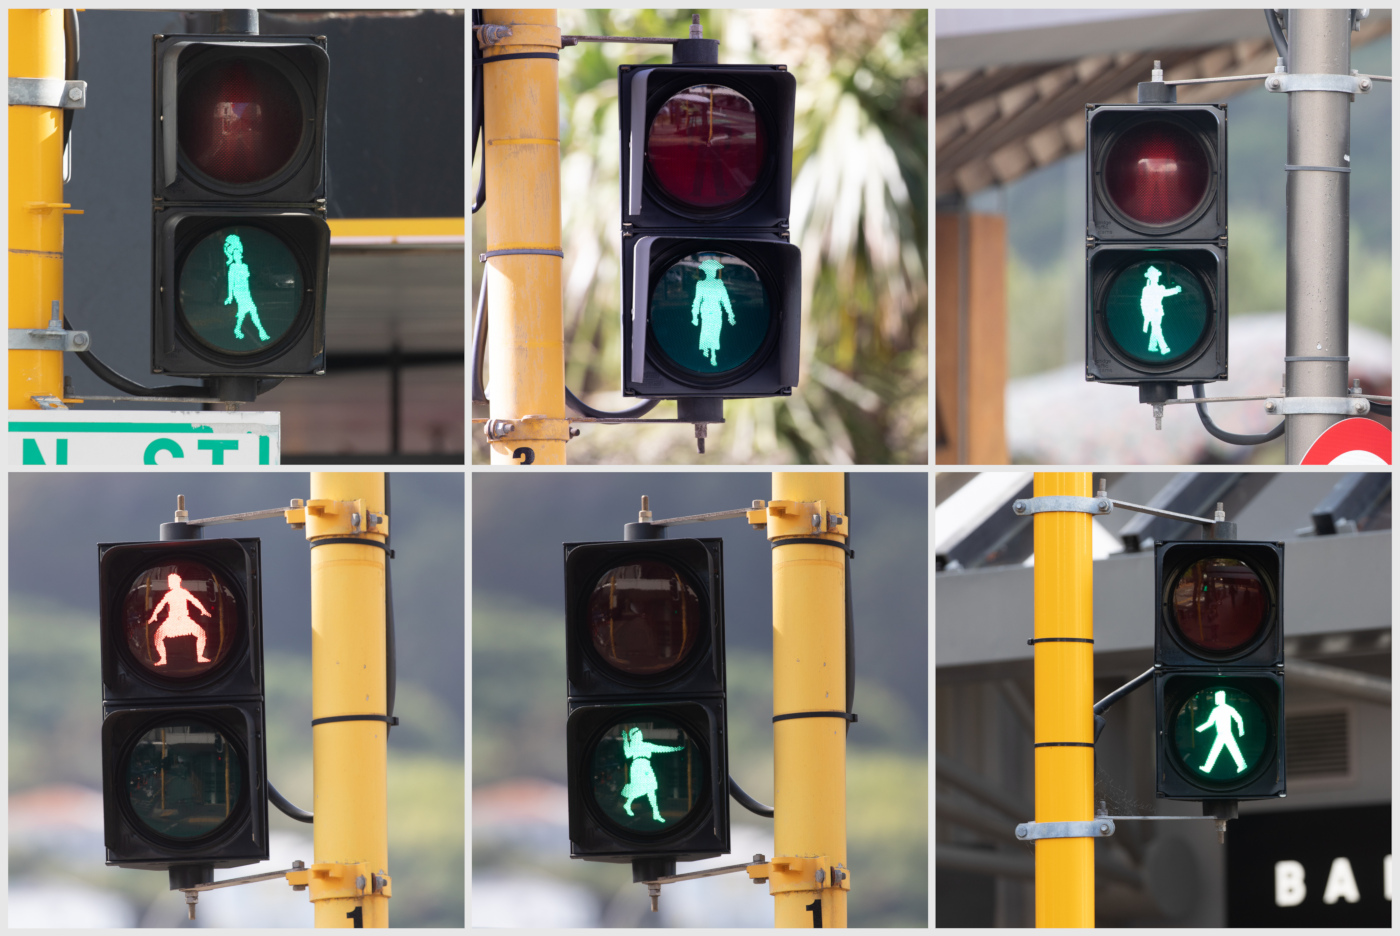
Last week I implemented support for generating very simple (grid only) collages from photos/images in my image processing infrastructure.
I had wanted to create some simple grid-based collages of some photos, and I was somewhat surprised to discover that neither Krita nor GIMP (free/open source image manipulation software) seem to provide any built-in functionality to generate this type of output, without manually setting up grids/guides and resizing and positioning each image separately - which while not difficult in theory - is somewhat onerous, especially when you want to generate multiple similar collages from different sets of input images in a procedural/repeatable way.
I did briefly look into (free) web-based solutions, however I wasn’t really happy with that avenue either, partly due to most web solutions having the same lack of procedural/recipe generation (i.e. being able to just change the input images and get the same type of result without re-doing things from scratch again), but also because many web solutions seemed more targeted at “artistic” collages with photos having arbitrary positions and rotations, rather than having grid presets, as well as the fact that many (although not all) of the web apps in question required some form of registration or sign-in.
So I ended up just quickly implementing basic support for this collage generation myself in my image processing infrastructure, which took less than two hours, and means I can now generate arbitrary grid collages from a ‘recipe’ source parameters file which configures the target output resolution, the row and column counts, input images list, inner and outer border widths and border colour, as well as the image resize sampling algorithm/filter to use (i.e. bilinear, bicubic, Lanczos, etc) for resizing the input images to fit into the collage grid.