C++ Compiler Benchmarks v2
This is another comparison of C++ compiler benchmarks on Linux using my Imagine renderer as the benchmark, almost three years since I did the last set of benchmarks.
This time, I’m only comparing versions of GCC and Clang, but I am also comparing the -Os optimisation level in addition to -O2 and -O3.
As with the previous benchmarks I did, I’m sticking with just comparing the standard “stock” optimisation levels, as it’s generally the starting point for compiler flags, and it makes things a fair bit easier, rather than trying every single combination of flags different compilers can support.
As it stands now, Imagine consists of 143,682 lines of C++ in 458 implementation files (.cpp), and 68,937 lines of C++ in 579 header files, for a total of 212,619 lines of code.
The compilers that I’m comparing are:
- GCC 4.8.5
- GCC 4.9.3
- GCC 5.4
- GCC 6.3
- GCC 7.1
- Clang 3.8
- Clang 3.9
- Clang 4.0
- Clang 5.0
GCC 4.8.5, GCC 5.4 and Clang 3.8 were Ubuntu packages, the other versions I compiled from source, using the methods recommended in the respective documentation.
The machine the tests were run on is the same machine the previous benchmarks were run on, but it now has an SSD system disk (which I ran the tests on in terms of target compilation), and a more up-to-date Linux distribution (Ubuntu 16.04 LTS). The machine is a dual socket Intel Xeon E5-2643 (3.3 Ghz) of Sandy Bridge vintage. Imagine’s code has also changed quite a bit in key areas, so these tests can’t be directly compared to the previous tests.
This time I didn’t run any microbenchmarks, just three different renders of different things in Imagine, basically rendering three different scenes. Due to the amount of things Imagine will be doing (ray tracing, light transport, material evaluation, splatting, etc, etc) this does mean that there’s a fair chance that code generated for different aspects can’t really be identified, as the timing will be for the render as a whole, but I think it still provides some indication as to what the compilers are doing relative to each other.
The compiler flags used to build Imagine were:
[main test optimisation flag] -fPIC -ffast-math -mfpmath=sse -msse -msse2 -msse3 -mssse3 -msse4
Compilation Benchmarks
Compilation time:
First of all I compared compilation time of all the compilers, building all of Imagine using different numbers of jobs (threads), from 16 (the total number of logical cores / threads my machine supports), down to 2. This was to try and isolate how parallel compilation can be (in particular with hyperthreading) when disk IO is a factor. Imagine’s source code was on an SSD, as was the directory for compiling.
Three runs from clean were done with each combination, and the time was timed with the command line ‘time’ command in front of the ‘make -jx’ command.
The graph below shows the results (mean averages).

As can be seen, there’s a fairly obvious pattern of O3 builds taking slightly longer than O2 builds, and Os builds taking slightly less than O2 builds as one would expect. In GCC, going from 8 to 16 threads (so effectively using hyperthreading on the machine, although it’s not clear what the scheduler was doing) gave practically no benefit in the older GCC versions, with a possible tiny benefit with 6.3 and 7.1, although 6.3 and 7.1 take noticeably longer to compile than older versions. Thread scalability after that is relatively close to linear, the difference probably being link time which cannot be parallelised as much.
Clang is consistently slower than GCC to build. I saw this in my previous tests I ran almost three years ago, and while in those tests I incorrectly enabled asserts when building it from source, making Clang builds slightly slower, even when disabling asserts back then it was still slower than GCC. This time I made sure asserts weren’t enabled, and it still seems to be slower than GCC, which seems to be against conventional wisdom, however it seems pretty consistent here. 5/6 years ago, I definitely found Clang faster to compile than GCC (4.2/4.4) when I benchmarked it, but that no longer seems to be the case.
Executable Size:
Below is a graph of the resultant executable size:
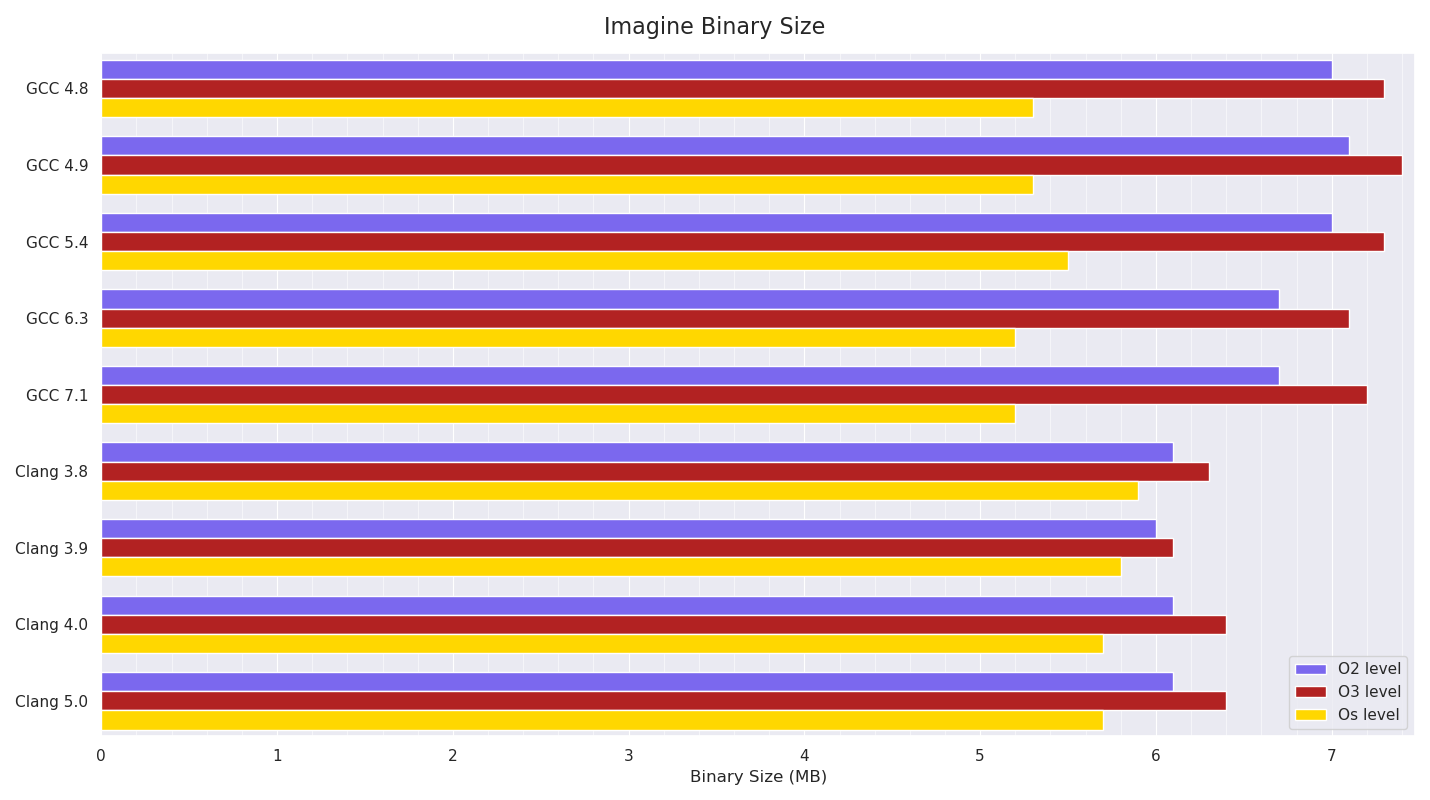
The pattern of O3 builds being bigger than O2 builds due to more aggressive optimisations (probably mainly more inlining and loop unrolling) is visible, and it’s noticeable how much smaller than O2 builds GCC’s Os builds are compared to Clang’s.
Rendering benchmarks
Scene 1:

Scene 1 consisted of a Cornell box (floor diffuse procedural texture with Beckmann microfacet spec lobe, walls diffuse + Beckmann microfacet spec lobes), with one bust model consisting of 544k triangles with a conductor microfacet BSDF (GGX), a dragon model consisting of 535k triangles with dielectric refractive lobe with brute force internal scattering for SSS with multiple scattering, and Beckmann microfacet dielectric lobe.
Three area lights (two quads, one sphere) were in the scene, each of which was sampled per hit / scatter (for next event estimation).
The resolution was 1024x768, with max path length of 6, using a volumetric integrator (which calculates full transmission for shadows, so it can’t early out in most cases), in non-progressive mode, using 144 stratified samples per pixel in basic pathtracing mode (no splitting) with MIS. The Mitchell-Netravali pixel filter was used for splatting.
Scene 2:
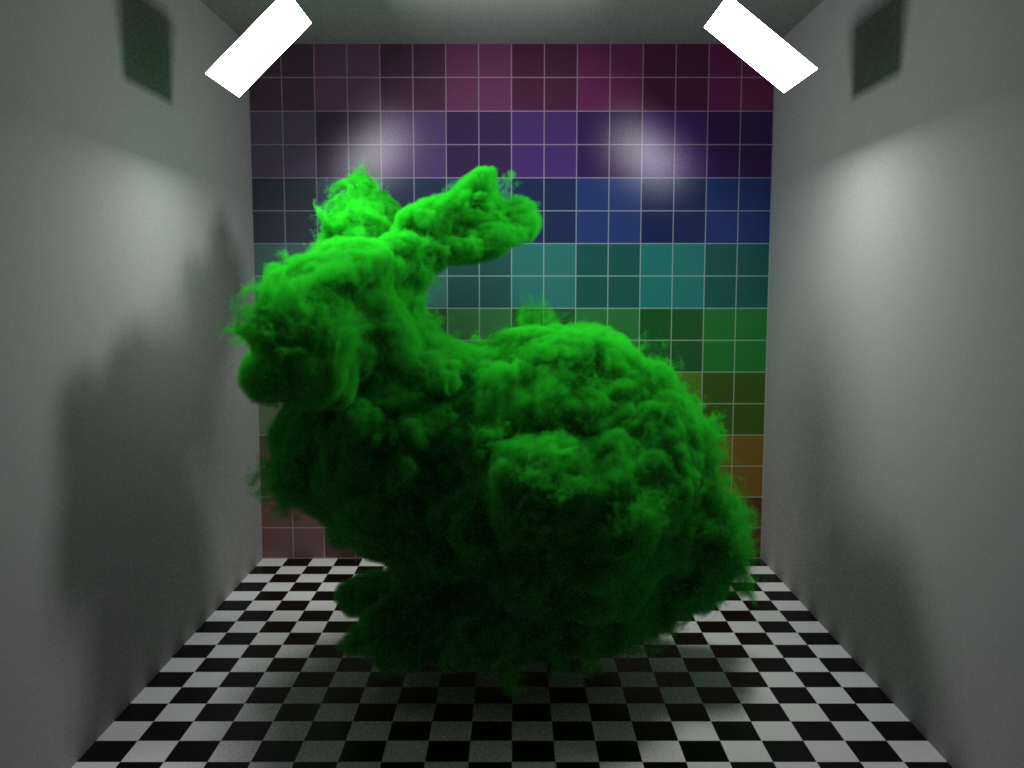
Scene 2 again consisted of a Cornell box, but with more basic materials (only the back wall had a spec lobe on in addition to diffuse), with two quad area lights, and a dense voxel grid volumetric bunny (converted from OpenVDB examples) with an Isotropic phase function. The resolution was again 1024x768, with max path length of 6, with 81 stratified samples used in non-progressive mode. The volumetric integrator was used, with Woodcock tracking volume sampling for the heterogenous voxel volume, with multiple scattering, and two transmittance samples per volume scatter event per light sample. Both lights were sampled per surface and volume scatter event for next event estimation. Volume roughening (falling back to nearest neighbour voxel lookup after ray roughness / throughput reaches a threshold) was turned off, so full trilinear voxel lookups were always done.
Scene 3:

Scene 3 consisted of a single 10M triangle mesh of a scanned church ornament, with a diffuse texture provided by a 1M point pointcloud lookup texture (KDTree). A very large filter radius was needed on the point lookups, due to the weird arrangements of the colour point values in the pointcloud in order to not have gaps in the resulting texture. A constant Beckmann spec lobe was also on the material.
A single Physical Sky Environment light was in the scene, with Environment Directional culling (culling directions on the Environment light that aren’t actually visible from the surface normal) disabled.
The resolution was 1024x768, max path length was 5, and a non-volumetric integrator was used this time, meaning occlusion ray traversal could early-out instead of having to find the closest hit and test transmittance through materials as the volume tests above had to. 81 stratified samples per pixel were used in non-progressive mode, with MIS path tracing.
Performance Results
Six runs of each were done, restarting each time to account for possible different memory layouts - Imagine is NUMA aware where possible, trying very hard to allocate and write (first touch) memory dedicated to the core/socket that will be running, but some things like triangles / geometry / acceleration structures can’t really be made NUMA-aware without duplicating memory which doesn’t really make sense, so it’s somewhat down to luck where memory will be (in terms of attached to which socket). 16 threads were used for rendering, and render thread affinity was set. The times are in seconds, and are for pure rendering (no loading, scene building or acceleration structure building included in the times), and were measured with code within Imagine. Mean averages are graphed below.
Scene 1
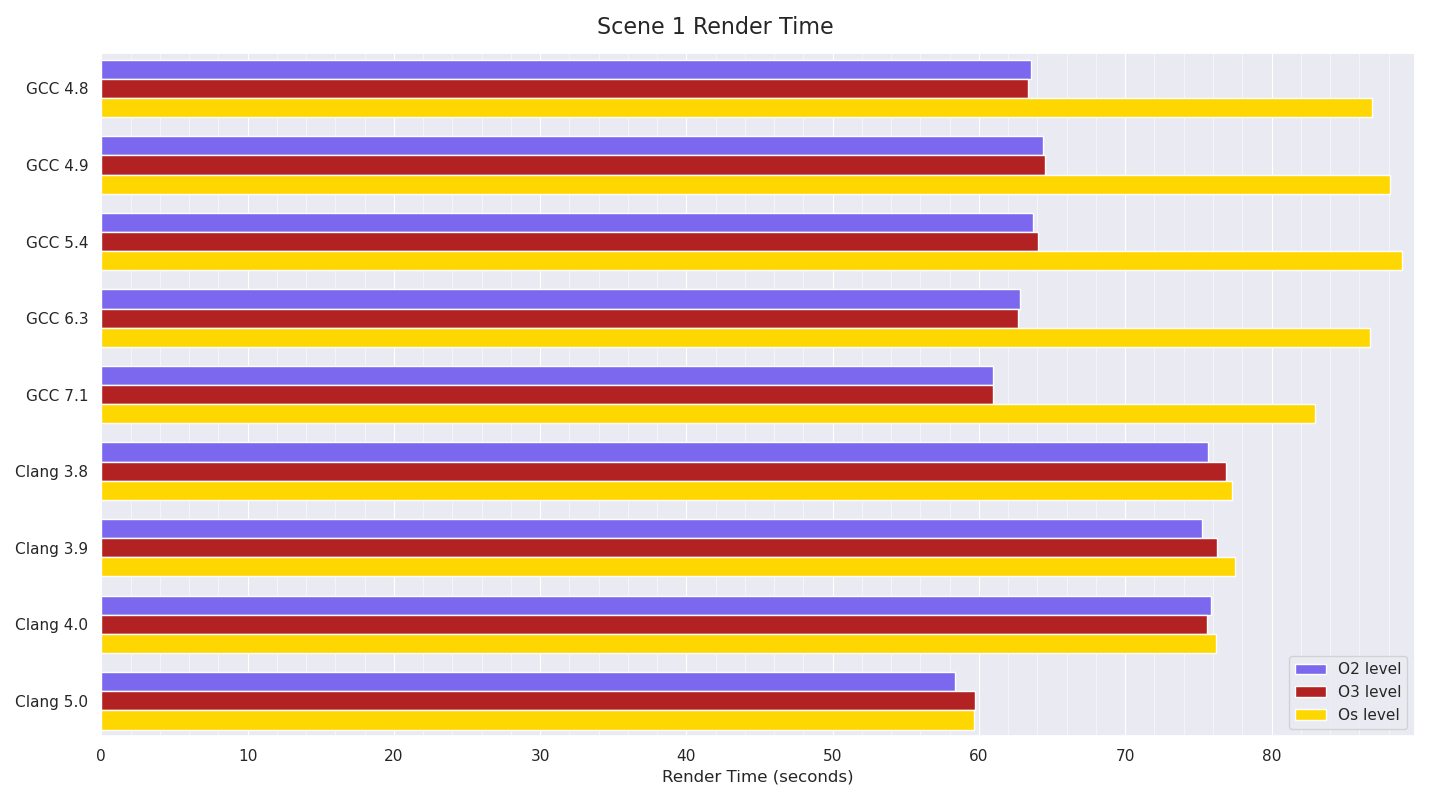
Scene 1 results show GCC 7.1 made some improvements over previous GCC versions, and that GCC’s Os builds are noticeably slower than its O2 or O3 ones. Until Clang 5.0, Clang was noticeably slower than GCC, however Clang 5.0 managed to just beat GCC 7.1’s numbers. Interestingly, Clang’s Os numbers show almost no difference to its more optimised builds, in contrast to GCC’s ratio between the optimisation levels.
Scene 2

Scene 2 shows a regression in performance going from GCC 4.9 to 5.4, which still hasn’t been recovered in GCC 7.1. Clang wins these by a comfortable margin. Again, Clang’s consistency between different optimisation levels is very close, in contrast to GCC’s, which is more pronounced.
Scene 3

Scene 3 is fairly similar to Scene 1 in that GCC 7.1 makes slight gains over previous GCC versions (and is the fastest), while until Clang 5.0, Clang was noticeably slower than GCC. Clang 5.0 almost makes up the gap to GCC 7.1.
Conclusion
Given these benchmarks are pretty much “overall” benchmarks, given within each test Imagine is doing so many different things, it’s very likely things are averaging out between the compilers, however, it does seem that Clang 5.0 made significant improvements over Clang 4.0 in two of the tests, becoming the new fastest in Scene 1 and almost matching GCC 7.1 in Scene 3. GCC 7.1 is the fastest in Scene 3, and almost the fastest in Scene 1, but GCC’s speed regression from 4.9 -> 5.4 in Scene 2 still impacts GCC 7.1, meaning Clang completely dominated Scene 2.
What was very interesting to me was the speed penalty GCC’s Os builds have compared to Clang’s Os builds. Given the executable size graph shows a similar ratio in terms of GCC’s Os builds being noticeably smaller than GCC’s O2 builds than Clang’s Os builds are than Clang’s O2 builds, it seems fairly obvious from the executable sizes produced that Clang is still fairly aggressively optimising Os builds, in contrast to GCC which seems to much more strongly prioritise smaller executable size.