I’ve been progressively trying to learn the Rust programming language for around a year and a half now and as well as porting some of my existing C/C++ apps I have to Rust as learning exercises (but with the C/C++ versions still mostly being the main ones for the moment) I have also started to write some new from-scratch apps in Rust when I think that makes sense, rather than defaulting to C/C++ as I previously would have.
I’d recently had the need to record some basic app process stats (CPU usage and RSS memory usage) over the duration of its running, and while there are existing applications out there - i.e. psrecord - that would largely do what I wanted, I was tempted to try and write my own version in a “native” language - at least for the recording part: the plotting / visualisation part is a bit more tricky. This was partly so as to have another small project with which to gain more experience with Rust, but also because I wanted additional features like the ability to control whether to have “normalised” or “absolute” CPU usage, and the ability to separate CPU time into user and system time - so I’ve written an initial version of psrec which is my own equivalent to psrecord written in Rust.
This initial version is pretty basic so far, and doesn’t yet support all the additional features I wanted: I’m making use of the psutil crate to extract the process information for the moment, but its functionality is incomplete as it doesn’t support extracting info on a process’ children, or info like the number of active threads a process has, which is functionality I will likely want at some point, so I’m no doubt going to have to get down in the weeds with the /proc/<pid>/ file system interface, which can sometimes seem a bit primitive and messy in my experience (it would be nice to have a first-class API to access the data efficiently, rather than doing string parsing, although it does make things very visual and easy to debug).
For the moment, I’m using Python and matplotlib to plot the resulting data, which to some extent is a bit at odds with writing the main app in a compiled language like Rust, but I think it’s okay for the moment, and it allows the recording app to theoretically be more efficient and low-overhead (although polling the /proc/ file system and recording samples every second isn’t really that much overhead), whilst using Python for things it’s very good at.
Below is a basic example of the chart plot of a quick process recording:
Last week I received a work-provided (on loan) new Apple MacBook Pro (14-inch, 2021) with the Apple M1 Pro 10-core processor, so I was very curious to see how it performed with some of my code, given the generally excellent reviews and reports I’d seen by people with it online.
I have my own MacBook Pro 15-inch 2015 (Intel i7) model which I’ll be comparing it against as a basic benchmark performance test, although it won’t be a completely fair test as the two machines are running different versions of MacOS and the clang compiler, and I didn’t want to upgrade my own machine’s MacOS version to a newer version (for various reasons). So the code being executed on the different machines will be generated by different versions of clang, but given the micro-architecture is totally different anyway, I think it’s still a meaningful test and at least will show the performance difference between the two laptops.
My old MacBook Pro 15-inch 2015 is a 2.5 GHz Intel Core i7, with four cores, eight threads, and 1600 Mhz DDR3 memory, running macOS 10.14.5 (Mojave), with Xcode 10.2.1 installed which has clang version 10.0.1.
The new MacBook Pro 14-inch 2021 is the M1 Pro 10-core version, with 8 performance cores and 2 efficiency cores, running macOS 12.3 (Monterey), with Xcode 13.4.1 installed which has clang version 13.1.6.
Tests:
I’ll be using two of my apps as benchmarks: my Mint interpreter language VM (originally based off Robert Nystrom’s excellent Crafting Interpreters Lox language tutorial) but with additional functionality and performance improvements, which I’ll use to benchmark two Mint scripts as single-threaded tests, and also my Imagine pathtracing renderer, which has native SSE intrinsics support for Intel and native Neon intrinsics support for ARM, which I’ll run in both single- and multi-threaded scenarios.
Both apps will be compiled with -march=native on the Intel side and -mcpu=native on the Apple M1 Pro ARM side, using the clang version on the machine in question, as well as optimisation level: -O3.
The two Mint script tests will be loop value calculation as Test 1:
var a = 1;
for (var i = 0; i < 100000000; i += 1)
{
    a = (i + i + 3 * 2 + i + 1 - 0.42) / a;
}
print a;
and a variation of Project Euler 21 to calculate the sum of all Amicable numbers under 15,000 as Test 2.
The Imagine rendering tests will render the below example scene of a basic maze with 12 spherical area lights and one hemisphere light, with four Next Event Estimation samples being taken each bounce to evaluate the lighting, and using Cone sampling to perfectly sample each spherical area light from each hitpoint, with 256 samples-per-pixel being done, using stratified sampling and a ray depth of 6 diffuse bounces. Depending on the setup of the tests (single-threaded, multi-threaded, etc), I’ll render the scene at resolutions of: 150 x 150, 300 x 300 and 600 x 600.
For all tests, I’ll run them on battery power and then mains power, in case that affects the clocking of the processors, and will also wait between test runs for the processor temperatures to be below 50 degC before running the next test, to try and reduce the impact of thermal throttling. However, for the longer-running multi-threaded Imagine rendering tests I’m fairly sure thermal throttling will start to take place on the Intel 2015 machine given how fast the fans start to spin in longer-running scenarios.
All tests will be run three times, and results below will show the mean average of those numbers.
Results
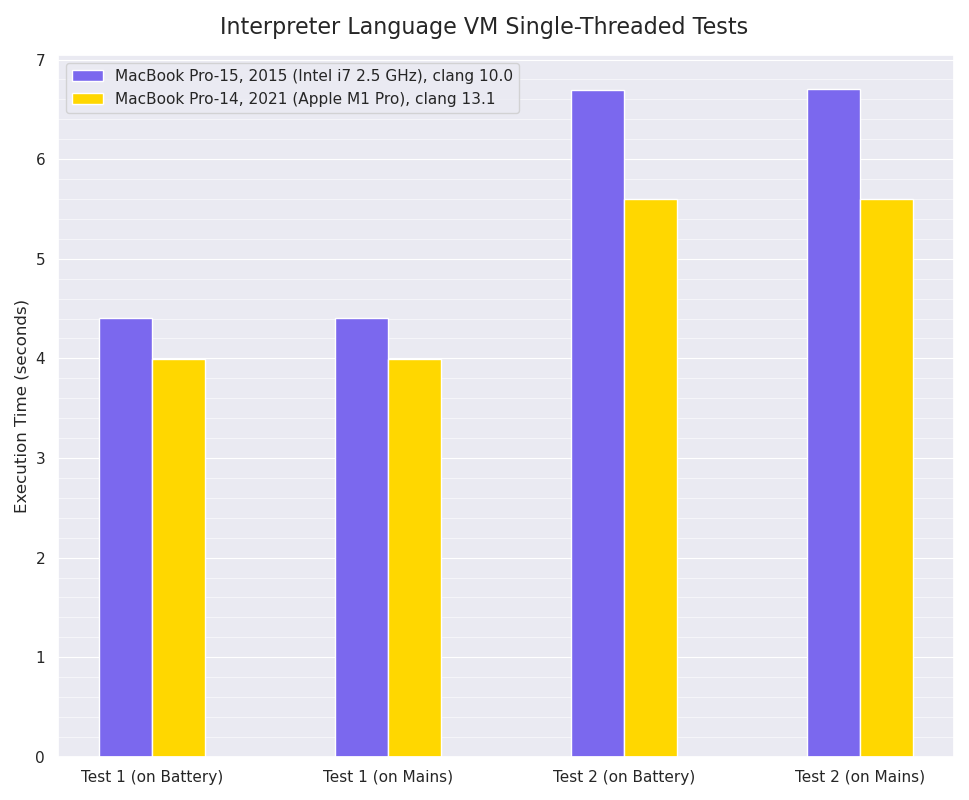
Single-threaded Mint VM interpreter:
Single-threaded Mint interpreter VM benchmarks, smaller values are better:
For these single-threaded tests, the M1 Pro has fairly modest (~11% faster in Test 1, ~16% faster in Test 2) improvements over the seven year old Intel i7, however as the Mint VM execution is often branch-prediction constrained within the main VM bytecode interpreter loop, I expect this doesn’t really allow the M1 Pro’s eight-wide design to really stretch its legs running these benchmarks, as there’s a limit to the amount of Instruction-Level Parallelism that’s achievable.
It’s interesting to see that there’s no apparent difference in performance between running on battery vs running connected to the mains: I was expecting to see a difference - even if only on the Intel i7 MBP - as I know my Thinkpad T480s running Linux shows significant performance differences between the two states, but Apple clearly don’t seem to be implementing that strategy.
Single-threaded Imagine rendering:
Single-threaded Imagine rendering benchmarks, smaller values are better:
Things start to look more impressive for the M1 Pro in the single-threaded rendering tests, as here there are a lot more floating point calculations being done with a lot less branching, and there’s a fair amount of SIMD use (i.e. ray intersection / traversal code, which uses native SSE or Neon instructions for the respective platform architectures) allowing the M1 Pro to show what it can do.
For both the 150 x 150 resolution and 300 x 300 resolution renders, the M1 Pro machine completed the tasks in ~46% less time, so it’s close to twice as fast as the older Intel machine. Again, there was no apparent performance difference between running powered off the battery compared to running with the machines plugged into the mains power.
Multi-threaded Imagine rendering:
Multi-threaded Imagine rendering benchmarks, smaller values are better:
The multi-threaded rendering tests show that for the shorter-duration 300 x 300 resolution render, the M1 Pro was more than three times faster (render time was less than a 1/3 of the Intel MBP’s i7 render time), and for the longer-duration 600 x 600 resolution render this ratio was slightly better still - I suspect because of the fact the Apple M1 Pro has significantly better thermal performance than the Intel i7, so is not throttling as much - if at all - although watching the temps on the M1 Pro machine towards the end of the test shows it did reach 84 degC, so it’s possible throttling is happening a bit.
Conclusion
So for most code that’s likely not branch/dependency-bound, it would seem the almost one year-old M1 Pro being tested here is around three times faster than the seven year-old Intel i7 model (although the base M1 Pro model with two less performance cores will not be as fast), and for multi-threaded code that parallelises well it can be more than three times faster, with much better thermal performance (which means less fan noise) and battery life, which is exactly what you’d want from a laptop, and I think shows that the Apple M1 processors are something to be excited about.
Over the past year I’ve become somewhat interested in visualisations of maps and terrain representations, and in particular “artistic” renders of relief maps. I’ve tried making a couple of different types of renderings of maps in some form or another over the past few years with varying degrees of success, and over the past few months I’ve been progressively creating what I’m terming “Minimalist” relief maps, where a surface is displaced by a Digital Elevation Model terrain height map (often to an exaggerated extent compared to real-word scale) with fairly simple shading, but using light and shadows as a key element to provide a sense of the terrain topology and height in a stylistic way.
These maps are a lot less manual-labour intensive to set up than the previous historical topographic ones I tried which required a lot of manual warping of the DEM images to match up with the historical map, so there’s a lot less effort (on my part anyway) to generate these more minimalistic style ones, and I still find them very nice to look at.
I’ve experimented with various different types of shading, with the main two types I settled on being the diffuse colour mapped to a colour gradient, driven by:
the terrain height value (the Y coordinate height in worldspace)
the occlusion ratio in a hemisphere around the shading point
The latter of which I think I like best (and is what both renders above show) as it allows nice highlighting of the edges and gradients of steeper terrain, although it means the stronger colours are generally in darker more occluded areas which hides it a bit, and the renders are slower as well, as additional raytracing to calculate the surface point occlusion needs to be done during shading.