PRNG Evaluation and Benchmarks for Monte Carlo Simulations
Imagine - being a stochastic pathtracing renderer, utilising the Monte Carlo method of random sampling to solve the Light Transport Equation - has had the need to generate large quantities of random numbers since fairly early on in its life, when I added support for Ambient Occlusion at the time it was still doing Whitted Raytracing (before I implemented full pathtracing support later that year). Initially, I was naively using the system rand() call to generate unit interval floating point values, like so:
float randomFloat()
{
	return rand() / (float(RAND_MAX) + 1.0f);
}
however I quickly realised this was incredibly slow due to all the system calls (especially on OS X, which I was mostly using at the time for development - on Linux the system call overhead was not as bad), as well as providing duplicate results between multiple threads (there’s a _r-suffix version for that problem). Around the same time I had just started reading PBRT 2, which had a basic version of the Mersenne Twister which I implemented, and got significant speed-ups from using instead. A few months later, I discovered the existence of the SIMD-oriented Fast Mersenne Twister version, which used SSE intrinsics instructions to speed up generation, which provided a bit of an extra boost.
Since then, I haven’t really thought that much about the PRNG (Pseudo-Random Number Generator) within Imagine in terms of speed (or quality), partly because sample generation wasn’t generally that much of an overhead (although in some pathological cases it could be more noticeable, i.e. non-adaptive renders doing large numbers of samples per pixel with almost nothing in the scene would end up spending a fairly large proportion of the CPU time generating samples), but also because Imagine uses several techniques to make sure the samples it uses based off the generated random numbers are well distributed amongst dimensions, and there was a tiny bit of leeway in how good the samples needed to be due to this (although better ones would still be more ideal). On top of that, I’d more recently implemented support for Low Discrepancy Sequences - like the Halton sequence - which are an alternative method of generating series of quasi/pseudo random numbers, and have some advantages in terms of being able to progressively draw samples with very low overheads that are well distributed/de-correlated with the samples from previous sequences, meaning the PRNG infrastructure wasn’t always being used as much.
I had become aware that the Mersenne Twister was far from state-of-the-art these days, and that there were much faster non-secure PRNGs available, often with better statistical properties as well, and I recently was curious to investigate some of them from a performance perspective, but also to do some fairly primitive - and unlikely to be statistically-principled! - evaluations of some of the results generated from them in the context of using them to generate the types of numbers Imagine requires for Monte Carlo sampling, which are essentially:
- 32-bit floating point unit interval numbers (between 0.0 and 1.0)
- 32-bit unsigned integers.
The basic statistical analysis I did of the generated random numbers was partly to see if I could notice any obvious issues, but mostly to ensure that my implementations and use of them were correct, and didn’t have any obvious bias or clumping issues in the distributions.
There are several fairly recent comparisons of PRNGs online which both benchmark them and provide some analysis of output from random number statistical analysis packages like PractRand, but they mostly seem to concern themselves with 64-bit integer numbers and double-precision floating point numbers which may or may not be directly relevant to the lesser requirements Imagine has. On top of that, some of the comparisons are using older PRNGs like Xoroshiro128 when there are newer versions like Xoshiro256 with apparently better properties (depending on which variant is used).
With that in mind, I decided to compare the following PRNGs:
- Linux System rand48()/drand48() calls
- Original Mersenne Twister (MT19937)
- SFMT (SIMD oriented Fast Mersenne Twister)
- Lehmer LCG
- PCG32
- Xoshiro256+
- Xoshiro256++
I’m including the System rand48()/drand48() simply an an interesting baseline, and several of the other choices (Lehmer LCG, and the two Mersenne Twister variants in particular) technically have some statistical issues with regards to quality, but I’m curious if I can actually spot any biases / issues in some of the basic evaluations I’ll be doing. It should be noted that some of these PRNGs do generate 64-bit numbers (the Xoshiro256 versions for example), but while I will use the code to generate those numbers, I will only be using float32 and uint32_t numbers. The other PRNGs (the two Mersenne Twisters, PCG32 and the LCG return 32-bit numbers, although PCG32 has the ability to generate 64-bit numbers, but I’m not using that).
PCG32 and the two Xoshiro256 variant PRNGs will be seeded using the SplitMix64 algorithm (which in itself is a PRNG of sorts), doing 16 shuffle rounds using SplitMax64 from the original single 32-bit seed number, and then using the required number of uint32_t values from the SplitMix64 generator for the state the PRNG needs.
I’m going to do several variations of the same type of tests, which will be very basic attempts to evaluate the distribution / uniform-ness of the random numbers. There are various statistical ways to do this in a more principled way (Chi Square test, Kolmogorov-Smirnov test, etc), however those aren’t perfect methods themselves, and I’d prefer something more visual, even if it is less principled and less robust. With that in mind, I’m going to generate binned “histograms” or density charts of number ranges and sample size combinations, and plot them in image form, in other words having a single pixel representing a histogram bin, and the colour of the pixel representing the value, with darker pixel values meaning the density of samples in that bin were higher.
All PRNGs for each same test will be seeded with the same source random number, however the different PRNGs will internally handle state initialisation from this seed in the recommended way (i.e. SplitMax64 in some cases), but each test type will use a different seed number.
1D floating point number generation
The first set of evaluation tests will be drawing a series of independent floating point numbers between 0.0 and 1.0, and converting that floating point number to an integer “histogram” bin index, and then incrementing the bin count for that bin index. After fitting these random number results into bins, the bin counts will then be normalised to the bin count with the maximum count, and a strip width PNG image with vertical bars of fixed strip height representing the normalised bin count density will be written out, with darker bars meaning higher bin counts. The test series will use 500 histogram bins (and so the image width will be 500 pixels, each horizontal pixel representing one histogram bin), and different densities of random numbers will be drawn for each series:
- 500 - low density to match the bin count
- 50,000 - a medium density of samples
- 5,000,000 - a high density of samples.
The average sum of these random numbers will also be recorded for each test (total sum of all 0.0 -> 1.0 random numbers drawn, divided by the number of random numbers drawn), which should average out to as close to 0.5 as possible.
Low Density 1D 500 Bin Histogram:
Results with 500 samples:
| PRNG | 500 bin histogram | Average |
|---|---|---|
| drand48() |  | 0.523126 |
| Mersenne Twister |  | 0.495327 |
| SFMT |  | 0.481424 |
| Lehmer LCG |  | 0.488260 |
| PCG32 |  | 0.507498 |
| Xoshiro256+ |  | 0.501831 |
| Xoshiro256++ |  | 0.513263 |
This test run is pretty unfair, as there’s only 500 random numbers that need to fit into 500 bins, so even with an extremely good PRNG there will be some clumping, and that’s going to be somewhat dependent on the bin widths (1.0 / 500 in this case). It would also likely be a bit fairer to do multiple runs with different seed numbers to show variations, but I haven’t really got time for such a comprehensive investigation as that, this is really just a representative look at a general sampling of the numbers to check for any obvious issues in the number distributions of my implementations.
It’s difficult to really draw any conclusions from this single test, but it might be possible to argue that the drand48() test shows the most clumping of values with four very dense bins, two of which are double-width adjacent bins, while Mersenne Twister, Lehmer LCG and PCG32 might seem to have the “best” distribution in this case.
Medium Density 1D 500 Bin Histogram:
Results with 50,000 samples:
| PRNG | 500 bin histogram | Average |
|---|---|---|
| drand48() |  | 0.498131 |
| Mersenne Twister |  | 0.497892 |
| SFMT |  | 0.497343 |
| Lehmer LCG |  | 0.498952 |
| PCG32 |  | 0.499932 |
| Xoshiro256+ |  | 0.501509 |
| Xoshiro256++ |  | 0.499024 |
With many more samples per potential bin, the results are much more uniform now, as the darker images show, with the average number results converging more closely to 0.5.
High Density 1D 500 Bin Histogram:
Results with 5,000,000 samples:
| PRNG | 500 bin histogram | Average |
|---|---|---|
| drand48() |  | 0.500111 |
| Mersenne Twister |  | 0.500030 |
| SFMT |  | 0.499919 |
| Lehmer LCG |  | 0.500040 |
| PCG32 |  | 0.499940 |
| Xoshiro256+ |  | 0.500205 |
| Xoshiro256++ |  | 0.499983 |
The images are too dark now to really see well, showing they’re now much more uniform (all bins are normalised to the maximum bin count). There’s still a bit of clumping, but it’s difficult to really know if this is a problem or not by just these image histograms alone. The Average number results once more converge even more closely to 0.5.
2D floating point number generation
The next set of evaluation tests will draw pairs of floating point numbers from each PRNG, and use them as X and Y coordinates to map them to a 2D histogram of 500 bins for each dimension, represented in image form by a 500x500 pixel image, with pixel values being normalised to the maximum bin count. Different densities of coordinate pairs will be drawn for each set of tests:
- 250,000 - low density of samples to match the total bin count
- 250,000,000 - a high density of samples.
The hope with this 2D test is to check for independence between the two numbers picked for each sample, and that there’s no correlation which shows up when using the two consecutively-generated numbers for two different dimensions.
For the second high-density test of 250 million 2D samples, I will also additionally modify the code to just generate the random number float values (500 million of them) without sorting them into bins or anything else, other than accumulating the total value (to stop the compiler optimising things away) and timing how long that takes. I will test this execution time code with two compilers, GCC 9 and clang 10 on a Linux laptop with an Intel i5-8350U CPU, with the laptop plugged into the mains and ensuring the machine is idle and the CPU temp is not throttling, with both -O2 and -O3 optimised build flags with each compiler.
Low Density 2D 500x500 Bin Histogram:
Results with 250,000 2D samples:
| PRNG | 500 bin histogram | AverageX AverageY |
|---|---|---|
| drand48() |  | 0.500969 0.499713 |
| Mersenne Twister |  | 0.501777 0.498884 |
| SFMT |  | 0.499758 0.499488 |
| Lehmer LCG |  | 0.498797 0.498904 |
| PCG32 |  | 0.500417 0.499793 |
| Xoshiro256+ |  | 0.500171 0.499525 |
| Xoshiro256++ |  | 0.500250 0.499567 |
While there are different noise patterns here, there doesn’t appear to be any obvious practical difference between the different PRNGs in the above images their output generated, nor are there any obvious clumping or gaps.
High Density 2D 500x500 Bin Histogram:
Results with 250,000,000 2D samples (500,000,000 float numbers in total):
| PRNG | 500 bin histogram |
|---|---|
| drand48() |  |
| Mersenne Twister |  |
| SFMT |  |
| Lehmer LCG |  |
| PCG32 |  |
| Xoshiro256+ |  |
| Xoshiro256++ |  |
With the higher density of samples, again, there’s nothing that really stands out: it does appear that there might be extremely faint clusters of slightly darker “shapes” in the noise in the PCG32 and Xoshiro256++ images near the centre, but without further investigation, those could well just be seed-specific, so I don’t think it’s anything to worry about.
And here are the isolated mean average performance numbers of four duplicate runs for all the PRNGs to generate the above 2D samples, for both GCC and clang compilers with two sets of optimisation levels for each, running in just one single-threaded process:
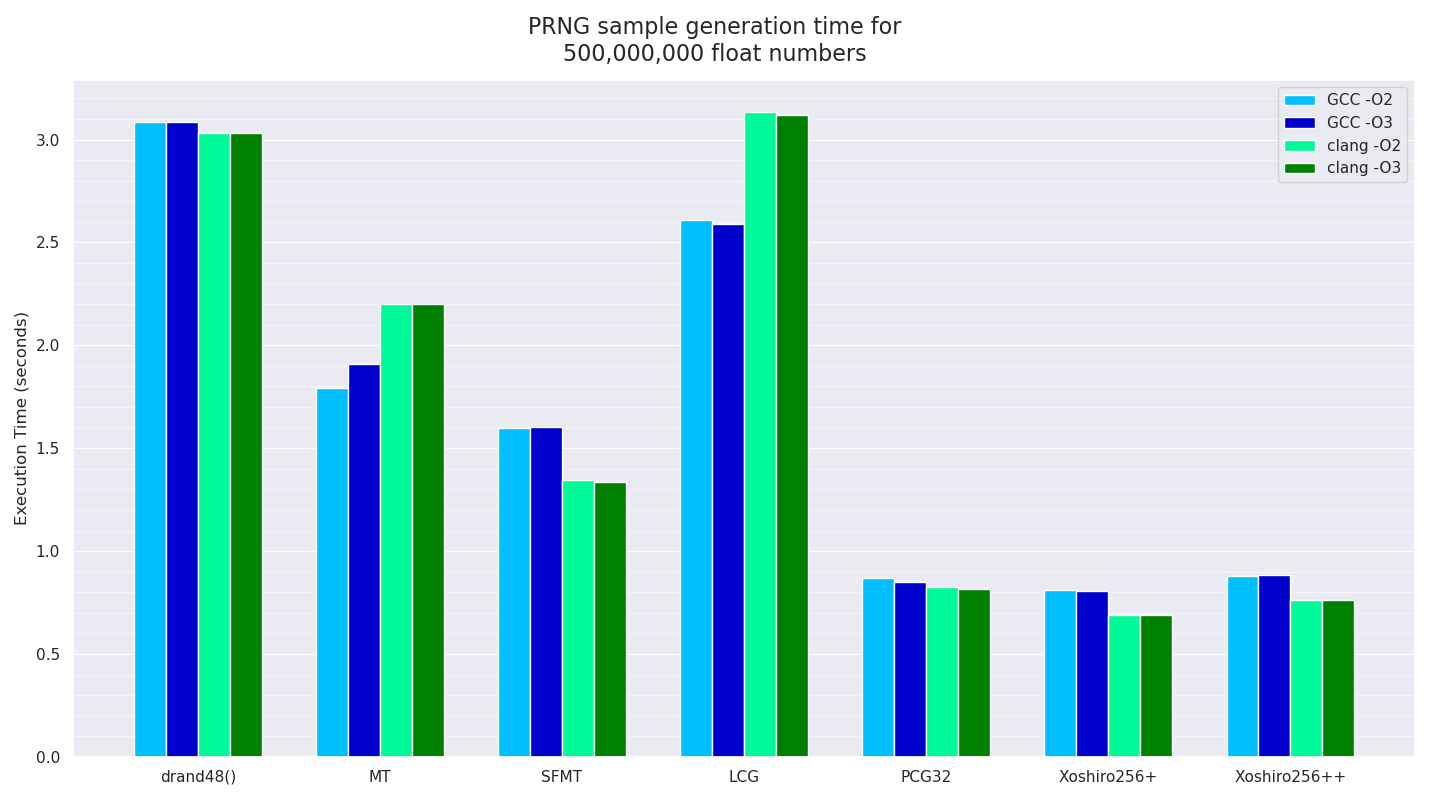
The system drand48() “PRNG” was pretty much the slowest (although the LGC PRNG compiled with clang was actually slower), with LGC compiled with GCC being the next fastest. The two Mersenne Twister variants are next fastest, but as expected, no longer competitive for this use-case, with PCG32 and the two Xoshiro256 variants being the fastest, depending on which compiler was used, with Xoshiro256+ being the absolute fastest.
1D unsigned integer number generation
These tests are similar to the 1D floating point tests, however I’m natively generating unsigned int values from the PRNGs rather than converting the native integer into a float32, and am using upper-bound rejection sampling to constrain the upper limit of the unsigned int values to prevent modulo bias, so as to generate sample integer values between 0 and 499 inclusive.
These values are then mapped to the corresponding histogram bins and accumulated per bin, and at the end of generating all the random numbers, the bin count values are all normalised to the maximum bin count, and PNG images are generated, with vertical pixel bars representing each bin being drawn, with darker bars meaning more dense samples for that number.
Low Density 1D 500 Bin Histogram:
Results with 500 samples:
| PRNG | 500 bin histogram | Average |
|---|---|---|
| rand48() |  | 249 |
| Mersenne Twister |  | 251 |
| SFMT |  | 234 |
| Lehmer LCG |  | 242 |
| PCG32 |  | 235 |
| Xoshiro256+ |  | 244 |
| Xoshiro256++ |  | 250 |
With a low density of samples, it’s difficult to really see any obvious issues from the sparseness of the results, although some PRNGs do seem to produce results which are more uniform and distributed than others, although that could just be due to the particular seed value used, so more analysis would need to be done to come to that conclusion.
Medium Density 1D 500 Bin Histogram:
Results with 50,000 samples:
| PRNG | 500 bin histogram | Average |
|---|---|---|
| rand48() |  | 249 |
| Mersenne Twister |  | 249 |
| SFMT |  | 249 |
| Lehmer LCG |  | 249 |
| PCG32 |  | 249 |
| Xoshiro256+ |  | 249 |
| Xoshiro256++ |  | 249 |
With the medium density of unsigned integer samples, uniform-ness of the results is much better as expected, however Xoshiro256+ does seem to show a bit more clumping (especially at the end of the range), and Xoshiro256++ might possibly be showing a bit of clumping in the middle of the range - but again, this might be due to the particular seed value used, and using another seed value might produce different results.
As a test of this theory, here’s a duplicate set of results, but with a different initial seed value, which does seem to indicate that might be the case:
| PRNG | 500 bin histogram | Average |
|---|---|---|
| rand48() |  | 249 |
| Mersenne Twister |  | 249 |
| SFMT |  | 249 |
| Lehmer LCG |  | 249 |
| PCG32 |  | 249 |
| Xoshiro256+ |  | 250 |
| Xoshiro256++ |  | 249 |
This does appear to show that the seed value does have significant influence on any subtle clumping or patterns in these basic image representations, and a much more comprehensive and in-depth analysis would be required in order to find out and investigate for certain.
1D biased unsigned integer number generation
I then decided to see if my “histogram” tests were actually capable of detecting any modulo bias, so ran the same tests again but with the code modified to just mod a single unsigned integer number by the 500 upper limit, which is a biased way of constraining the resultant integer values, but is faster to generate.
Low Density 1D 500 Bin Histogram:
Results with 500 samples:
| PRNG | 500 bin histogram - biased | Average |
|---|---|---|
| rand48() |  | 229 |
| Mersenne Twister |  | 232 |
| SFMT |  | 246 |
| Lehmer LCG |  | 229 |
| PCG32 |  | 253 |
| Xoshiro256+ |  | 245 |
| Xoshiro256++ |  | 246 |
With biased unsigned int range-limited generated numbers with low density, there’s slightly more obvious clumping occurring now, along with some evidence of very small numbers being picked more often for many of the PRNGs, and the “average” resultant value numbers are a bit more varied and generally a bit lower than with the non-biased modulo limiting method.
Medium Density 1D 500 Bin Histogram:
Results with 50,000 samples:
| PRNG | 500 bin histogram - biased | Average |
|---|---|---|
| rand48() |  | 245 |
| Mersenne Twister |  | 243 |
| SFMT |  | 245 |
| Lehmer LCG |  | 244 |
| PCG32 |  | 244 |
| Xoshiro256+ |  | 243 |
| Xoshiro256++ |  | 243 |
Moving on to the medium density of random numbers, it now becomes abundantly clear that using a biased method of clamping the random numbers is picking very low numbers much more often than other numbers in the total required range, and that the distribution is not uniform with this method. The “average” resultant values are also now consistently lower (243-245) than the corresponding correct and non-biased version of this test above, which produced the expected average of 249 consistently for all PRNGs.
Conclusion
Based on this basic analysis / benchmark, as well as looking at what other people have decided online with their comparisons and analysis, it seems clear that Mersenne Twister / SFMT is not the PRNG to be using these days, even if purely from a performance perspective. It does also suffer from some theoretical statistical issues that more modern statistical test frameworks are capable of looking for, however it’s not clear if those are actually noticeable in practice for Imagine’s use-case of random numbers: my basic analysis above doesn’t really highlight any concerns, but there could be something very subtle there that these basic tests won’t show.
The three fastest PRNGs in these tests are PCG32, Xoshiro256+ and Xoshiro256++, and while Xoshiro256+ is the fastest, it does have some slight statistical issues with unsigned integer number generation which for some use-cases might not be ideal, and consensus seems to be that Xoshiro256++ is the safer bet, even if it is slightly slower.
So with that in mind, that’s what I’ve converted Imagine to use, and the resulting speed-ups of going from SFMT to Xoshiro256++ are fairly modest in most cases, but measurable non-the-less.