LIDAR Digital Surface Model Map Renders
I’ve started experimenting with rendering representations of LIDAR-measured Digital Surface Model map datasets, which in contrast to Digital Elevation Model or Digital Terrain Model datasets - which are more common, and only consist of the raw terrain elevation data - have human-built structures in the height data (i.e. buildings). Previous Map Renderings (A full list of ones I’ve done so far can be found here) have involved DEM model data which just consists of the natural terrain, and in terms of scale, I’ve focused there on rendering entire countries or islands.
So I’ve been curious to try generating more detailed imagery of more localised areas, in particular of cities where human-made buildings and architecture are clearly visible, and here are some very early initial attempts with the raw DSM data for London.
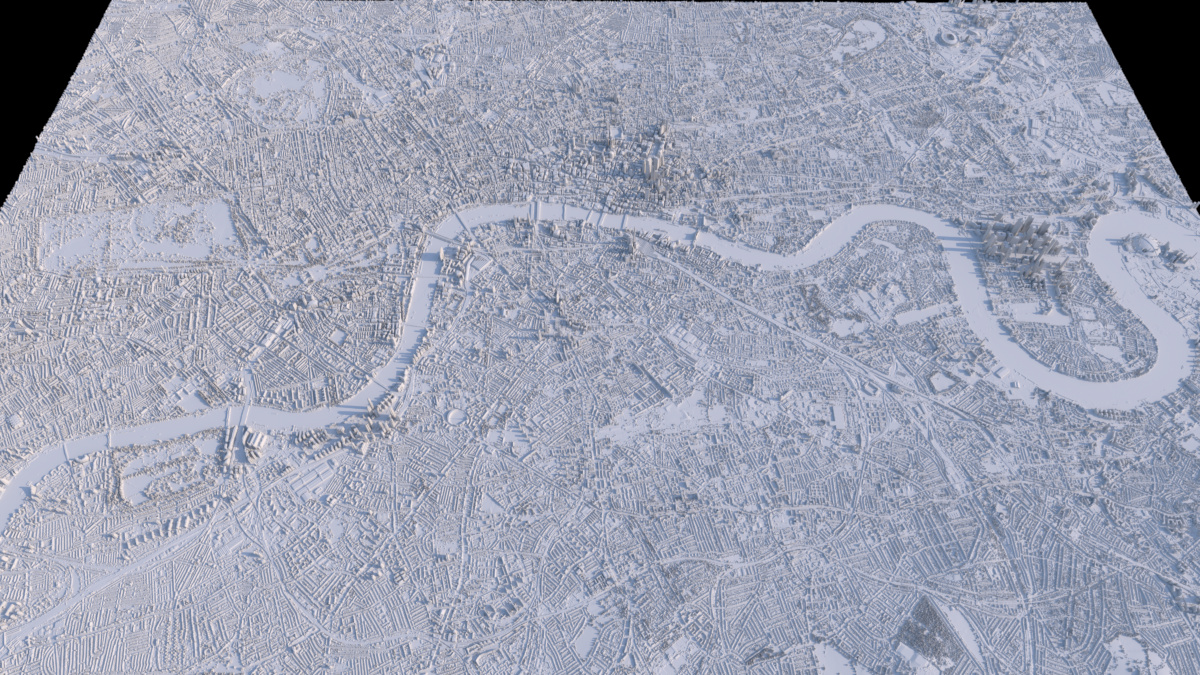 The above render (Full 2.5k Render) is just a plain render of the surface being displaced by the LIDAR dataset values, using data from the UK’s Environment Agency from the LIDAR Composite DSM 2022 - 1m dataset showing central London.
(Note that when downloading the tilesets from the website, the category defaults to the ‘DTM’ Digital Terrain Model version which doesn’t have buildings, so ensure you switch to the ‘DSM’ version if that’s the one you want.)
When zoomed out and viewed from above, the fidelity seems pretty good: showing buildings, bridges and trees in nice detail.
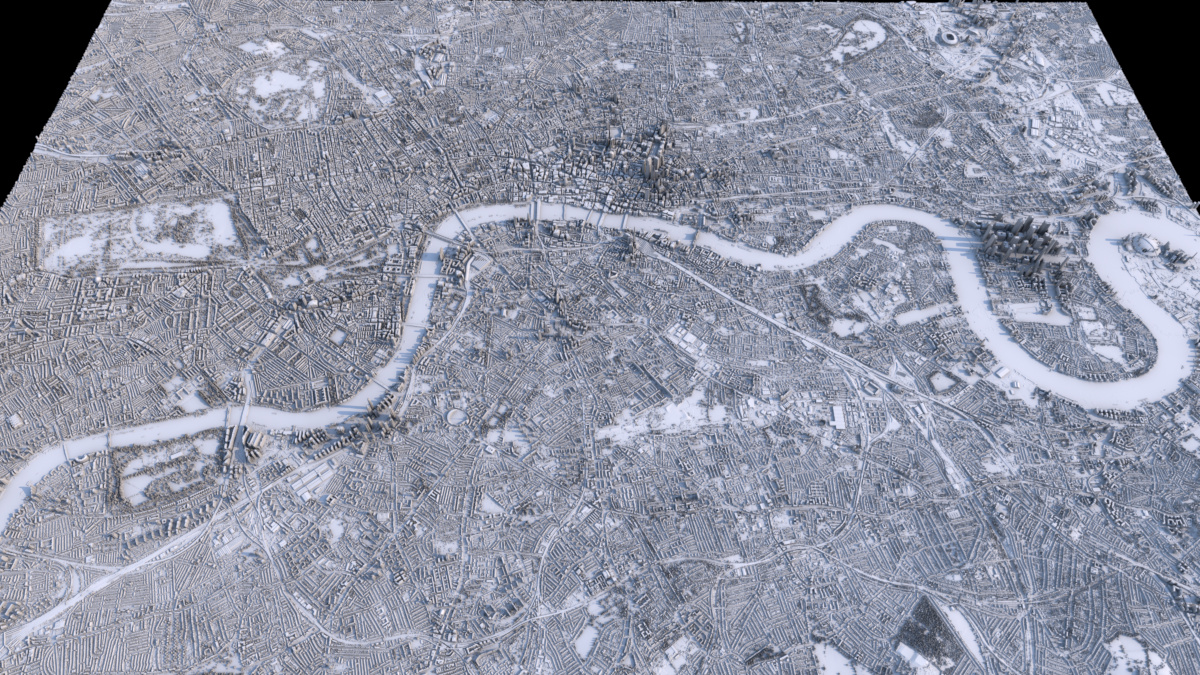
Using a slightly less boring shader look - an occlusion shader, driving a diffuse surface colour gradient - gives what I think is a quite pleasing effect, accentuating the streets:
 (Full 2.5k Render)
The height scale I’ve used is not physically-based to real scale (to the horizontal extents) currently: I’ve just eyeballed something which looks fairly reasonable, but I think it’s probably a bit too high still.
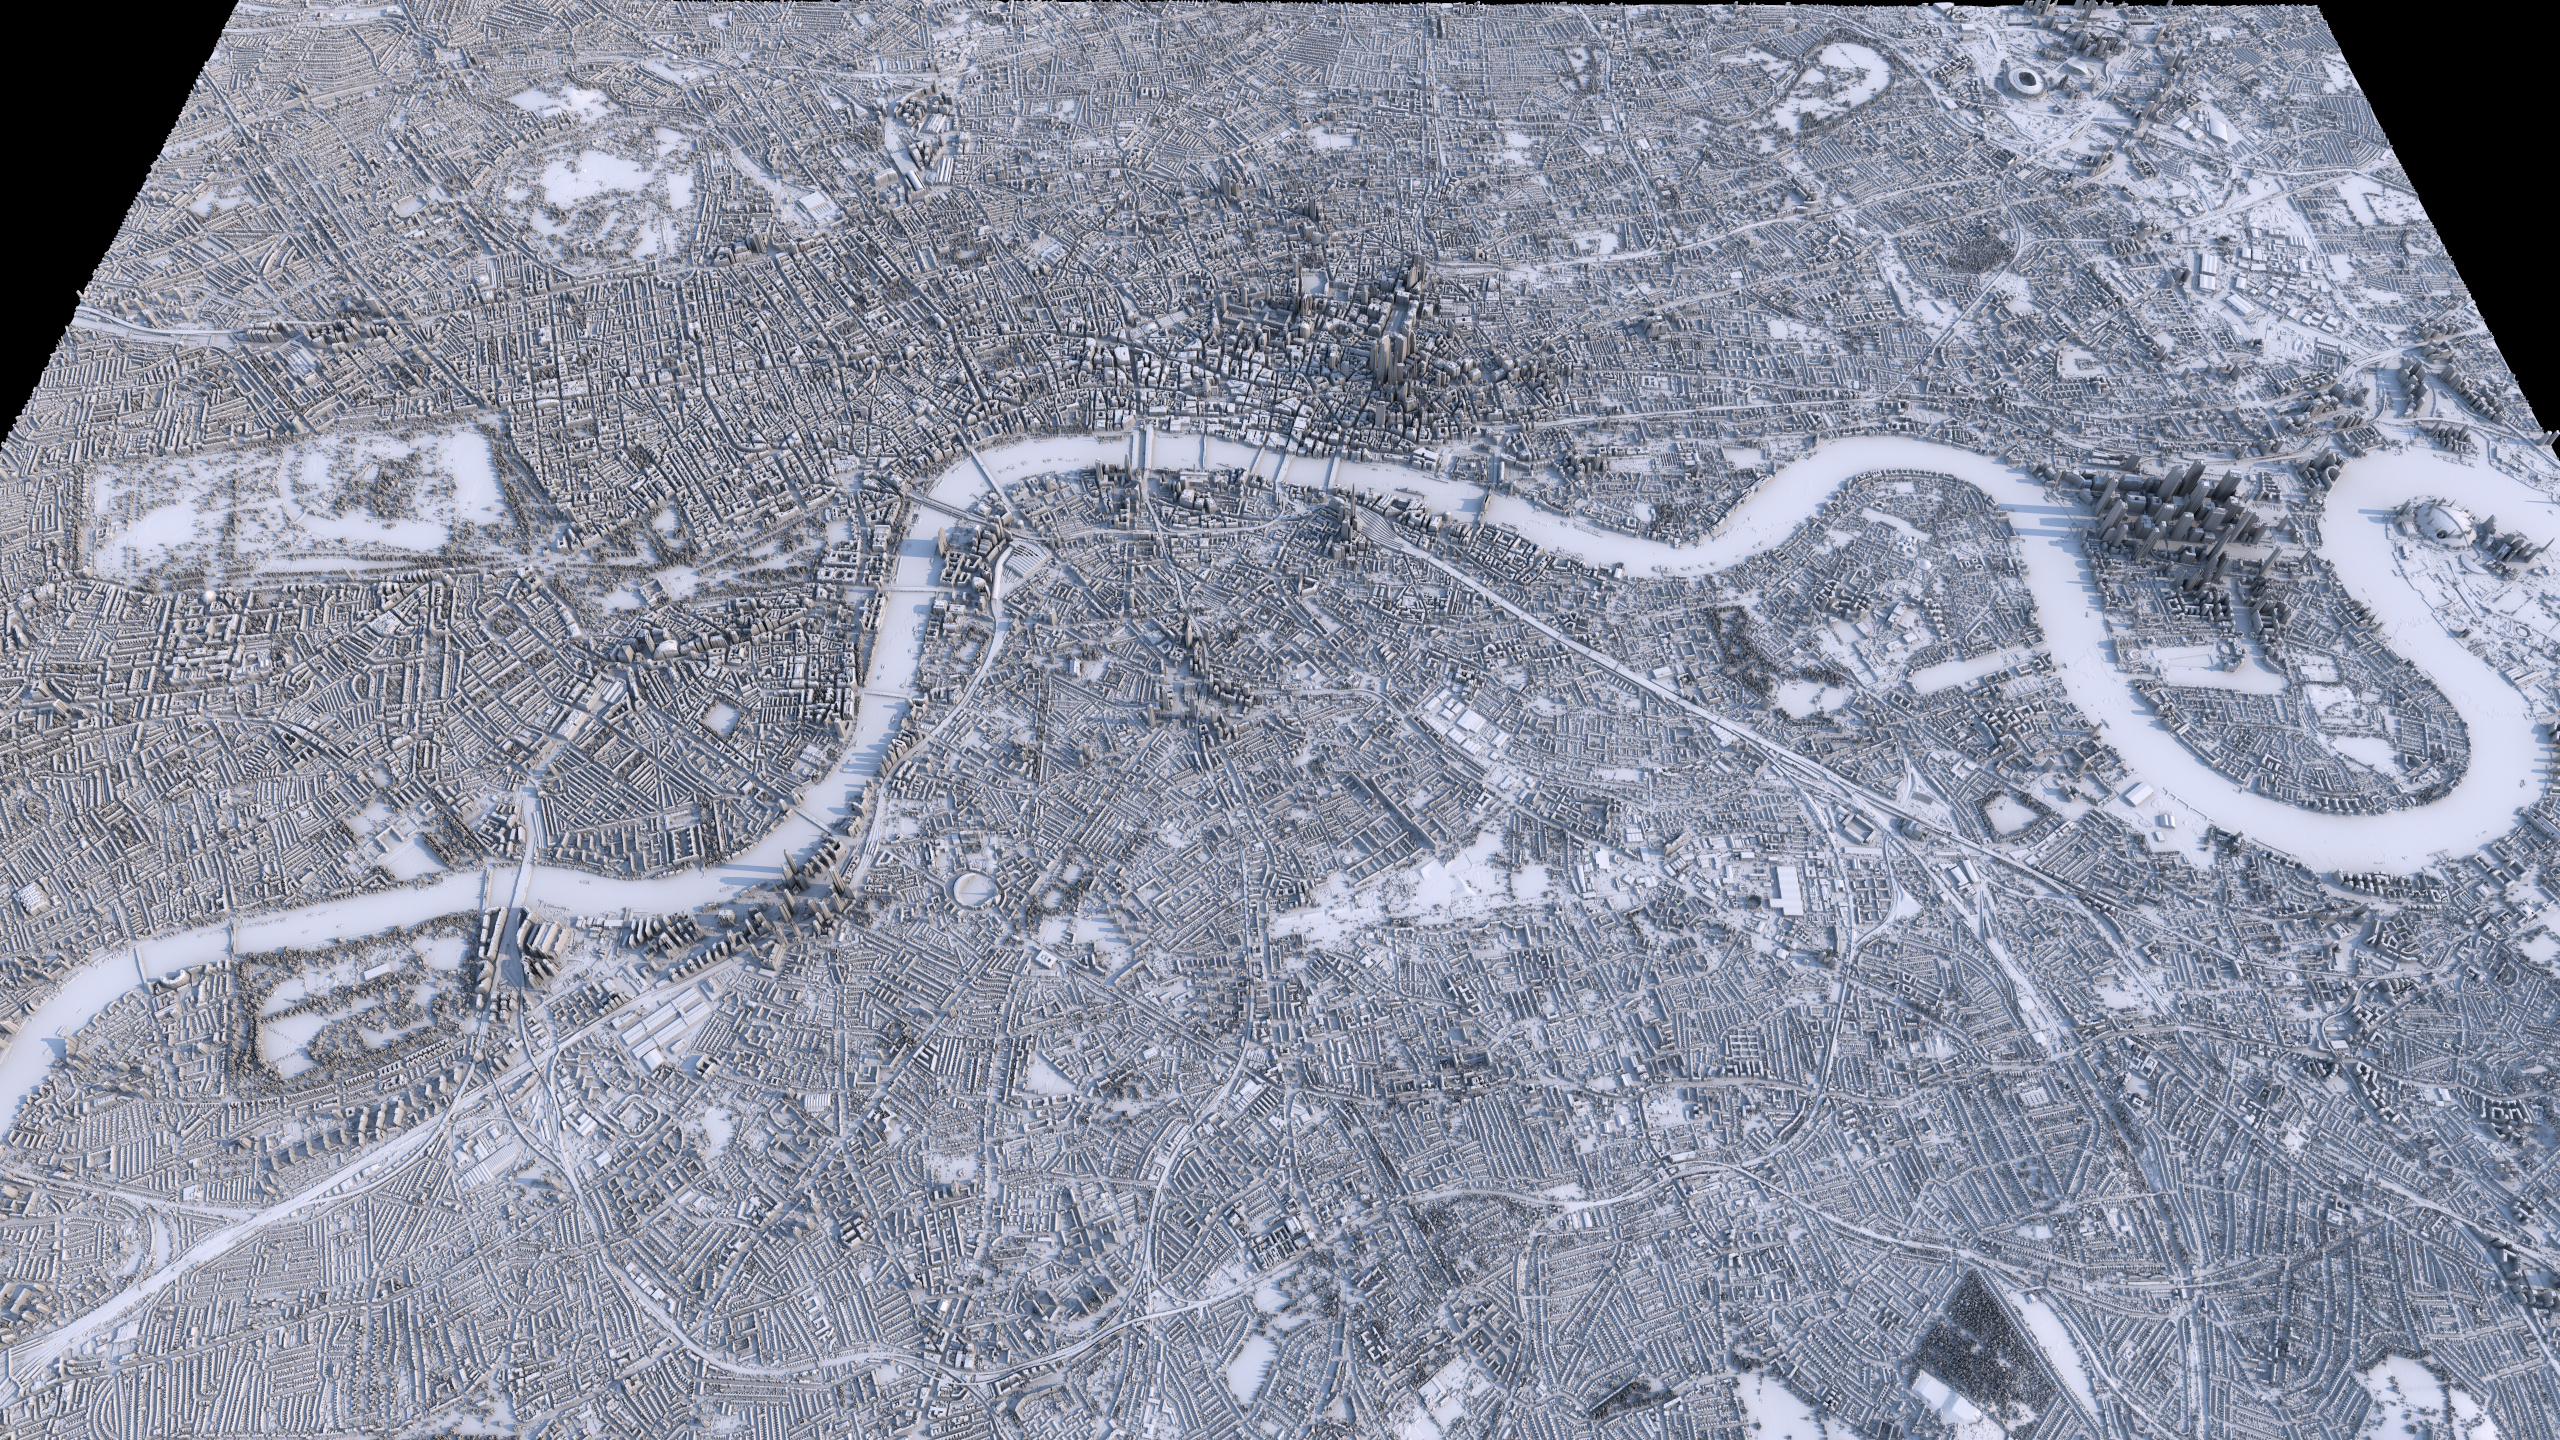
Once you start to look at the resulting generated surface in a bit more detail from closer up or at a more horizontal viewing angle, then the understandable limitations of the fidelity and format (2D single height values) of the data becomes a bit more apparent, especially in situations like overhangs, where single DEM/DSM values per point on a 2D surface are obviously limited. This can be seen in representations of bridges (there’s no gap underneath them), Tower Bridge and the London Eye in the below alternative view render: 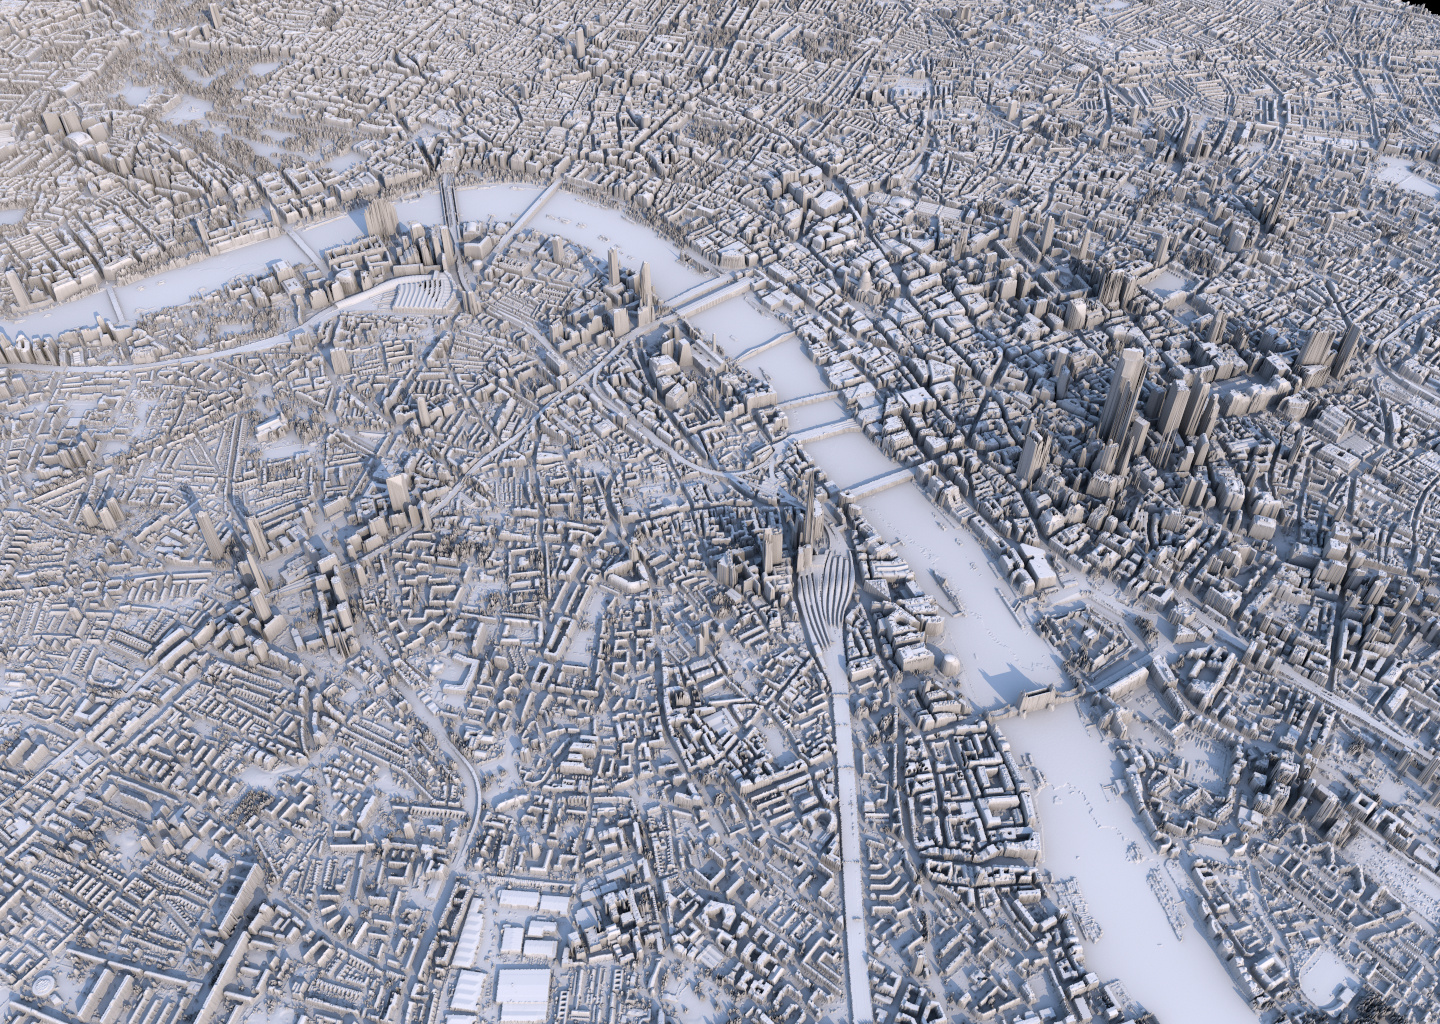
London did seem to previously have some 25 cm resolution DSM datasets available at some point, but data.gov.uk doesn’t seem to have those any more, although they may still be part of other overall datasets, so I’ll try and find them. That won’t solve the ‘overhang’ problem (you’d need to use a full 3D point-cloud representation for that), but it should provide extra detail which might be interesting.
I’d also like to try and colour in water areas (and maybe foliage-heavy areas like parks) specific colours to add a bit more contrast and produce some more “artistic” versions, which I’ll look into doing over the next few months. Looking at rendering other cities that have more hilly terrain than London might be interesting as well, in order to have a combination of terrain and human-built buildings. I did look to see if I could find LIDAR DSM models of Wellington, NZ (where I’m currently living), which has an interesting combination of the two (although most buildings are quite small on the hills here), but I could only find DEM terrain models (without structures) for NZ. Cities like San Francisco are likely to have good data in this category, and I’ll have a look at other cities as well to see what’s available.