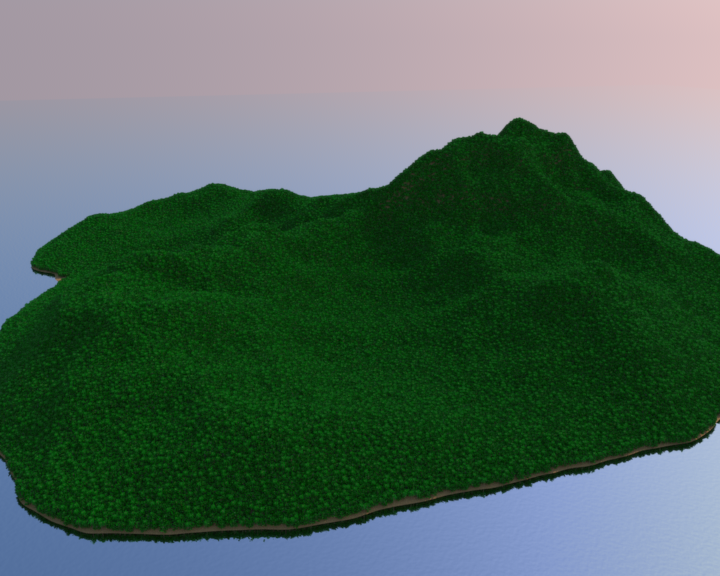
This is another comparison of C++ compiler benchmarks on Linux using my Imagine renderer as the benchmark, almost three years since I did the last set of benchmarks.
This time, I’m only comparing versions of GCC and Clang, but I am also comparing the -Os optimisation level in addition to -O2 and -O3.
As with the previous benchmarks I did, I’m sticking with just comparing the standard “stock” optimisation levels, as it’s generally the starting point for compiler flags, and it makes things a fair bit easier, rather than trying every single combination of flags different compilers can support.
As it stands now, Imagine consists of 143,682 lines of C++ in 458 implementation files (.cpp), and 68,937 lines of C++ in 579 header files, for a total of 212,619 lines of code.
The compilers that I’m comparing are:
GCC 4.8.5
GCC 4.9.3
GCC 5.4
GCC 6.3
GCC 7.1
Clang 3.8
Clang 3.9
Clang 4.0
Clang 5.0
GCC 4.8.5, GCC 5.4 and Clang 3.8 were Ubuntu packages, the other versions I compiled from source, using the methods recommended in the respective documentation.
The machine the tests were run on is the same machine the previous benchmarks were run on, but it now has an SSD system disk (which I ran the tests on in terms of target compilation), and a more up-to-date Linux distribution (Ubuntu 16.04 LTS). The machine is a dual socket Intel Xeon E5-2643 (3.3 Ghz) of Sandy Bridge vintage. Imagine’s code has also changed quite a bit in key areas, so these tests can’t be directly compared to the previous tests.
This time I didn’t run any microbenchmarks, just three different renders of different things in Imagine, basically rendering three different scenes. Due to the amount of things Imagine will be doing (ray tracing, light transport, material evaluation, splatting, etc, etc) this does mean that there’s a fair chance that code generated for different aspects can’t really be identified, as the timing will be for the render as a whole, but I think it still provides some indication as to what the compilers are doing relative to each other.
First of all I compared compilation time of all the compilers, building all of Imagine using different numbers of jobs (threads), from 16 (the total number of logical cores / threads my machine supports), down to 2. This was to try and isolate how parallel compilation can be (in particular with hyperthreading) when disk IO is a factor. Imagine’s source code was on an SSD, as was the directory for compiling.
Three runs from clean were done with each combination, and the time was timed with the command line ‘time’ command in front of the ‘make -jx’ command.
The graph below shows the results (mean averages).
As can be seen, there’s a fairly obvious pattern of O3 builds taking slightly longer than O2 builds, and Os builds taking slightly less than O2 builds as one would expect. In GCC, going from 8 to 16 threads (so effectively using hyperthreading on the machine, although it’s not clear what the scheduler was doing) gave practically no benefit in the older GCC versions, with a possible tiny benefit with 6.3 and 7.1, although 6.3 and 7.1 take noticeably longer to compile than older versions.
Thread scalability after that is relatively close to linear, the difference probably being link time which cannot be parallelised as much.
Clang is consistently slower than GCC to build. I saw this in my previous tests I ran almost three years ago, and while in those tests I incorrectly enabled asserts when building it from source, making Clang builds slightly slower, even when disabling asserts back then it was still slower than GCC. This time I made sure asserts weren’t enabled, and it still seems to be slower than GCC, which seems to be against conventional wisdom, however it seems pretty consistent here. 5/6 years ago, I definitely found Clang faster to compile than GCC (4.2/4.4) when I benchmarked it, but that no longer seems to be the case.
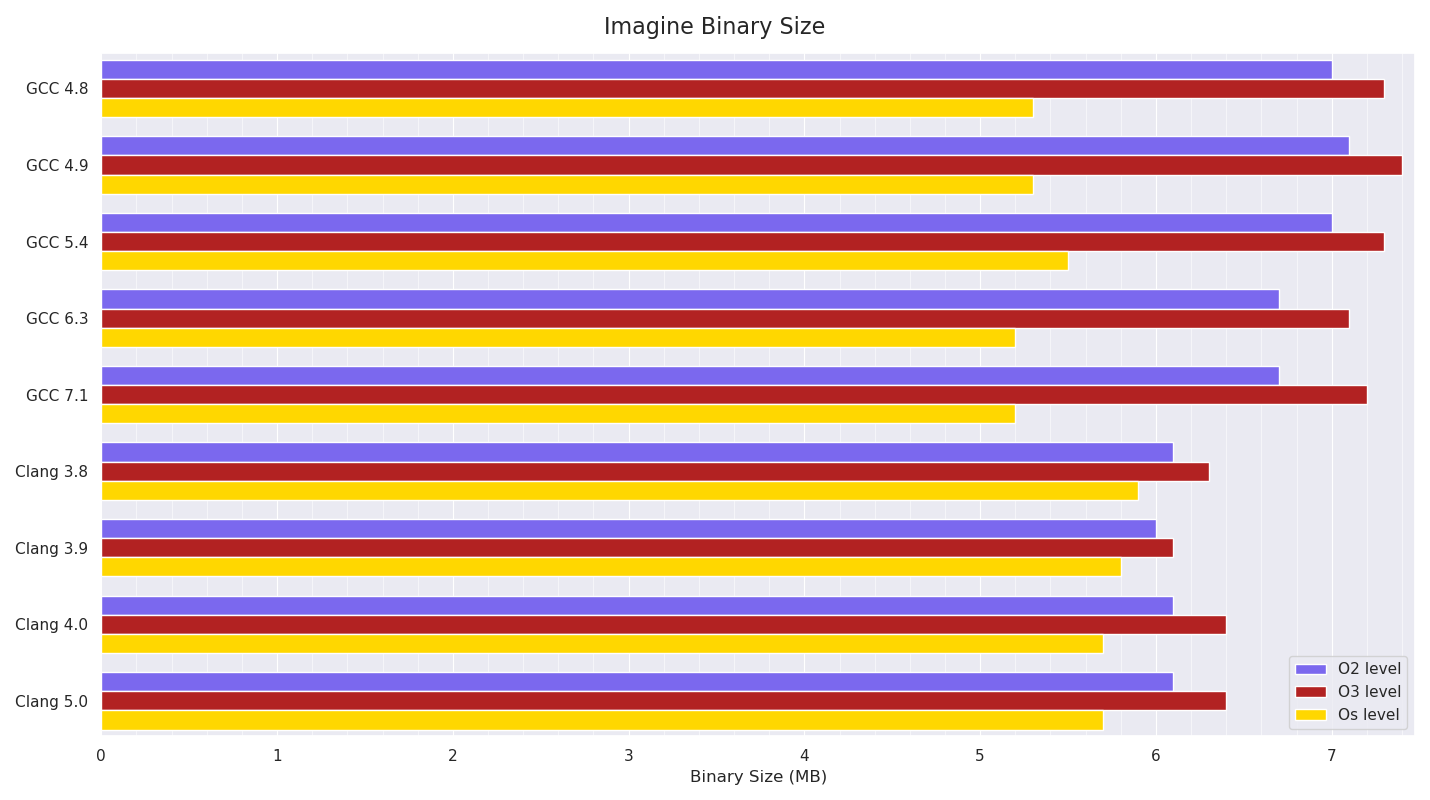
Executable Size:
Below is a graph of the resultant executable size:
The pattern of O3 builds being bigger than O2 builds due to more aggressive optimisations (probably mainly more inlining and loop unrolling) is visible, and it’s noticeable how much smaller than O2 builds GCC’s Os builds are compared to Clang’s.
Rendering benchmarks
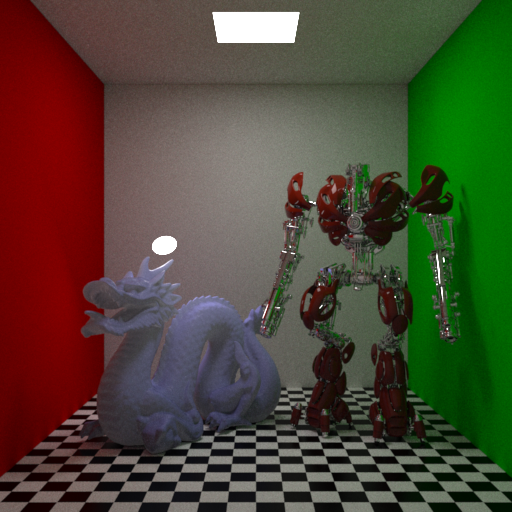
Scene 1:
Scene 1 consisted of a Cornell box (floor diffuse procedural texture with Beckmann microfacet spec lobe, walls diffuse + Beckmann microfacet spec lobes), with one bust model consisting of 544k triangles with a conductor microfacet BSDF (GGX), a dragon model consisting of 535k triangles with dielectric refractive lobe with brute force internal scattering for SSS with multiple scattering, and Beckmann microfacet dielectric lobe.
Three area lights (two quads, one sphere) were in the scene, each of which was sampled per hit / scatter (for next event estimation).
The resolution was 1024x768, with max path length of 6, using a volumetric integrator (which calculates full transmission for shadows, so it can’t early out in most cases), in non-progressive mode, using 144 stratified samples per pixel in basic pathtracing mode (no splitting) with MIS. The Mitchell-Netravali pixel filter was used for splatting.
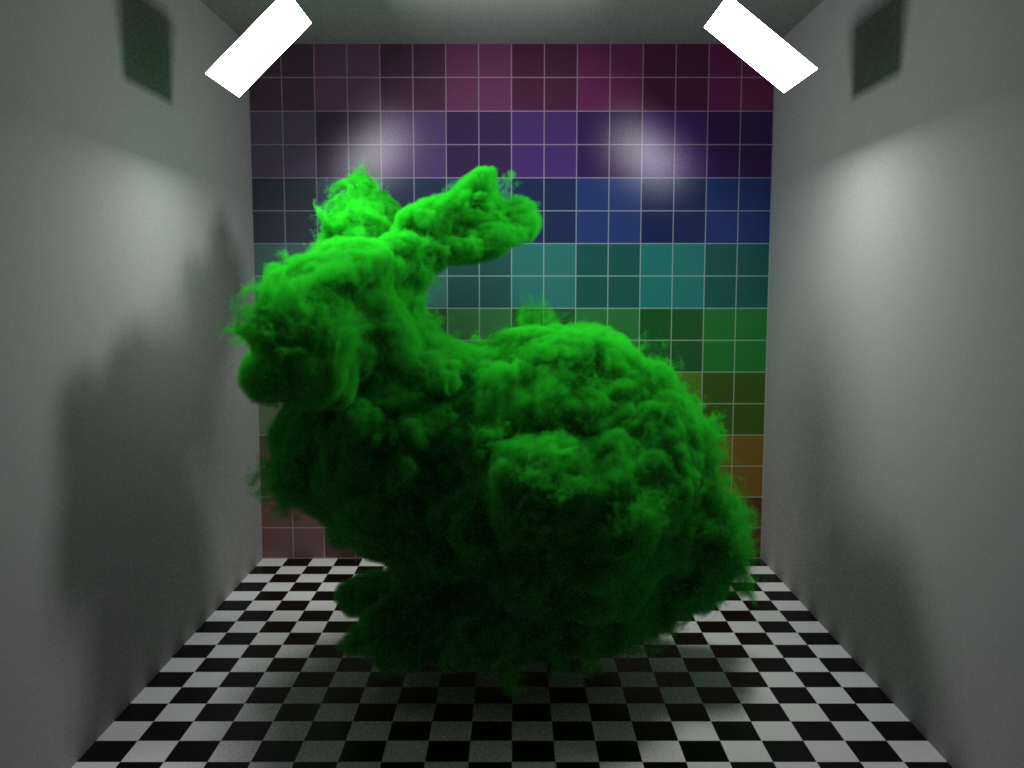
Scene 2:
Scene 2 again consisted of a Cornell box, but with more basic materials (only the back wall had a spec lobe on in addition to diffuse), with two quad area lights, and a dense voxel grid volumetric bunny (converted from OpenVDB examples) with an Isotropic phase function. The resolution was again 1024x768, with max path length of 6, with 81 stratified samples used in non-progressive mode.
The volumetric integrator was used, with Woodcock tracking volume sampling for the heterogenous voxel volume, with multiple scattering, and two transmittance samples per volume scatter event per light sample. Both lights were sampled per surface and volume scatter event for next event estimation. Volume roughening (falling back to nearest neighbour voxel lookup after ray roughness / throughput reaches a threshold) was turned off, so full trilinear voxel lookups were always done.
Scene 3:
Scene 3 consisted of a single 10M triangle mesh of a scanned church ornament, with a diffuse texture provided by a 1M point pointcloud lookup texture (KDTree).
A very large filter radius was needed on the point lookups, due to the weird arrangements of the colour point values in the pointcloud in order to not have gaps in the resulting texture. A constant Beckmann spec lobe was also on the material.
A single Physical Sky Environment light was in the scene, with Environment Directional culling (culling directions on the Environment light that aren’t actually visible from the surface normal) disabled.
The resolution was 1024x768, max path length was 5, and a non-volumetric integrator was used this time, meaning occlusion ray traversal could early-out instead of having to find the closest hit and test transmittance through materials as the volume tests above had to. 81 stratified samples per pixel were used in non-progressive mode, with MIS path tracing.
Performance Results
Six runs of each were done, restarting each time to account for possible different memory layouts - Imagine is NUMA aware where possible, trying very hard to allocate and write (first touch) memory dedicated to the core/socket that will be running, but some things like triangles / geometry / acceleration structures can’t really be made NUMA-aware without duplicating memory which doesn’t really make sense, so it’s somewhat down to luck where memory will be (in terms of attached to which socket). 16 threads were used for rendering, and render thread affinity was set. The times are in seconds, and are for pure rendering (no loading, scene building or acceleration structure building included in the times), and were measured with code within Imagine.
Mean averages are graphed below.
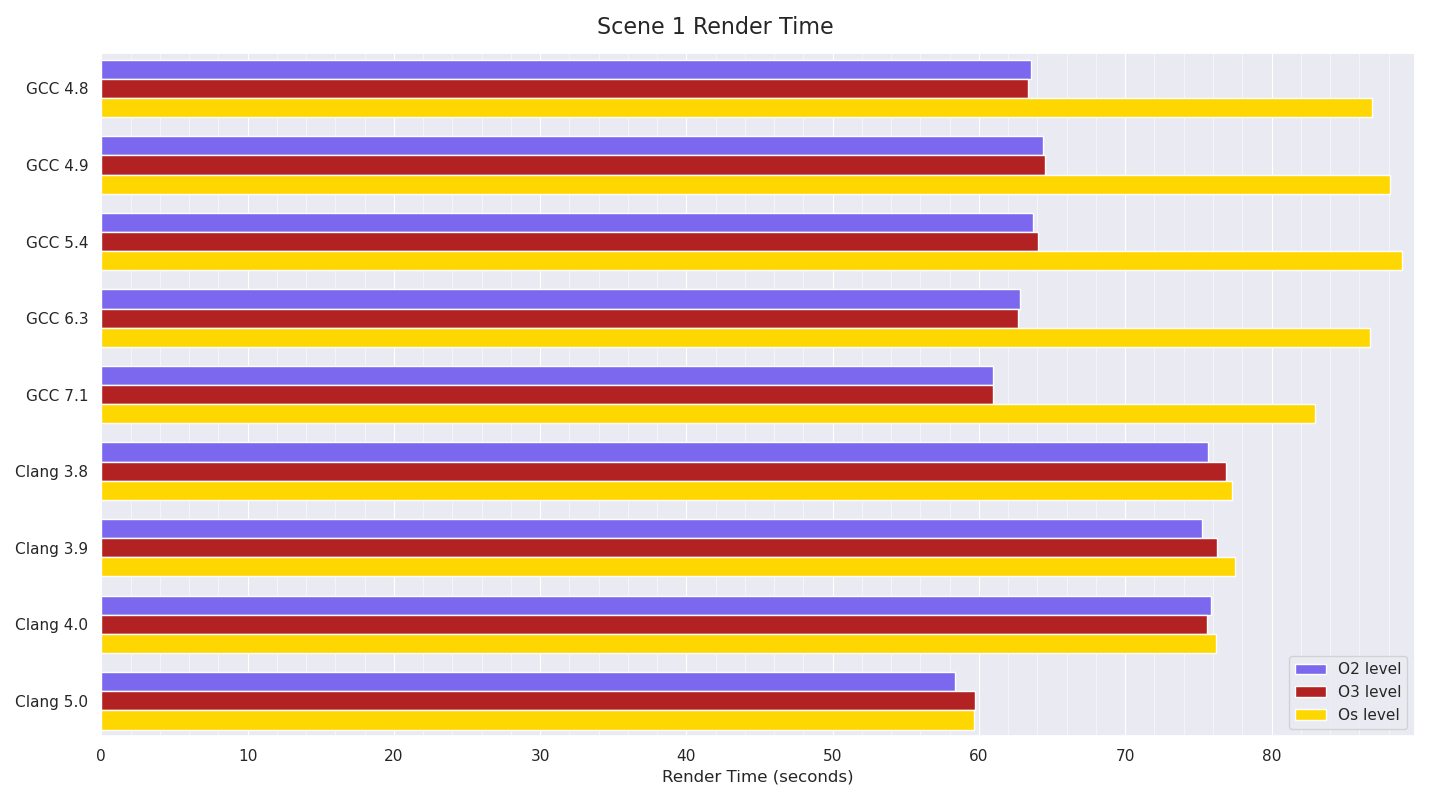
Scene 1
Scene 1 results show GCC 7.1 made some improvements over previous GCC versions, and that GCC’s Os builds are noticeably slower than its O2 or O3 ones. Until Clang 5.0, Clang was noticeably slower than GCC, however Clang 5.0 managed to just beat GCC 7.1’s numbers. Interestingly, Clang’s Os numbers show almost no difference to its more optimised builds, in contrast to GCC’s ratio between the optimisation levels.
Scene 2
Scene 2 shows a regression in performance going from GCC 4.9 to 5.4, which still hasn’t been recovered in GCC 7.1. Clang wins these by a comfortable margin.
Again, Clang’s consistency between different optimisation levels is very close, in contrast to GCC’s, which is more pronounced.
Scene 3
Scene 3 is fairly similar to Scene 1 in that GCC 7.1 makes slight gains over previous GCC versions (and is the fastest), while until Clang 5.0, Clang was noticeably slower than GCC. Clang 5.0 almost makes up the gap to GCC 7.1.
Conclusion
Given these benchmarks are pretty much “overall” benchmarks, given within each test Imagine is doing so many different things, it’s very likely things are averaging out between the compilers,
however, it does seem that Clang 5.0 made significant improvements over Clang 4.0 in two of the tests, becoming the new fastest in Scene 1 and almost matching GCC 7.1 in Scene 3. GCC 7.1 is the fastest in Scene 3, and almost the fastest in Scene 1, but GCC’s speed regression from 4.9 -> 5.4 in Scene 2 still impacts GCC 7.1, meaning Clang completely dominated Scene 2.
What was very interesting to me was the speed penalty GCC’s Os builds have compared to Clang’s Os builds. Given the executable size graph shows a similar ratio in terms of GCC’s Os builds being noticeably smaller than GCC’s O2 builds than Clang’s Os builds are than Clang’s O2 builds, it seems fairly obvious from the executable sizes produced that Clang is still fairly aggressively optimising Os builds, in contrast to GCC which seems to much more strongly prioritise smaller executable size.
Recently, I had been about to upgrade my Linux distro on my main workstation at home, and this brought an upgrade to GCC 4.8 from 4.7 as the base GCC version. Before I upgraded the distro I tried building Imagine with 4.8.3 built from source, and needed to fix some template code as g++ 4.8+ (ICC has never liked it either) now doesn’t like using pure abstract classes as a template type. I made this change to the code, and did some quick approximate benchmarks between 4.7.3 and 4.8.3 which showed there wasn’t really any improvement, so I decided to try 4.9.2 which had just been released. This seemed to showed a fairly serious regression in terms of speed (speed being a pretty important aspect for a renderer), so I decided I’d do a more comprehensive comparison of the latest main compilers for the Linux platform, as back in 2011 and 2012 I used to do compiler benchmarks (GCC, Clang and ICC) regularly every six months or so on my own code (including Imagine), and on the commercial VFX compositor made by the company I worked for at the time, and it had been a while since I’d compared them myself.
I’ve never really liked just doing micro-benchmarks/synthetic benchmarks of just loops, etc of simple code, as they can paint a distorted picture of what’s going on, which can’t always be realised when the same code is put in context within other code - a good example of this is C++ virtual function overhead, which I’ve previously benchmarked, and while it’s possible to see overheads in micro-benchmarks, the same code within an actual real application shows no issues (at least in my particular usage of them) - so I always try to benchmark code doing what it was designed for from a user’s perspective: in Imagine’s case, this is rendering, or aspects related to that.
As it stands now, Imagine consists of over 164,000 lines of C++ code (including comments) in 386 .cpp files and 484 .h files, included heavily (more-so than I’d like, as it causes pretty severe final binary code bloat) templated code for everything from the acceleration structures, image texture / filtering infrastructure to geometry attribute / indices / triangle type code and a fair amount of SSE intrinsics usage for some of the acceleration structures, image filtering, procedural noise textures and triangle packet intersection code. The rest of the code is standard 2003 C++ - GCC 4.1.2 is still used heavily in the VFX industry (due to plugin ABI compatibility issues), so I still want to be able to build Imagine with this compiler if need be. Other than (optional) image library libs (OpenEXR, libpng, libtiff, libjpeg) for file readers/writers, there are no other requirements/dependencies Imagine needs to build.
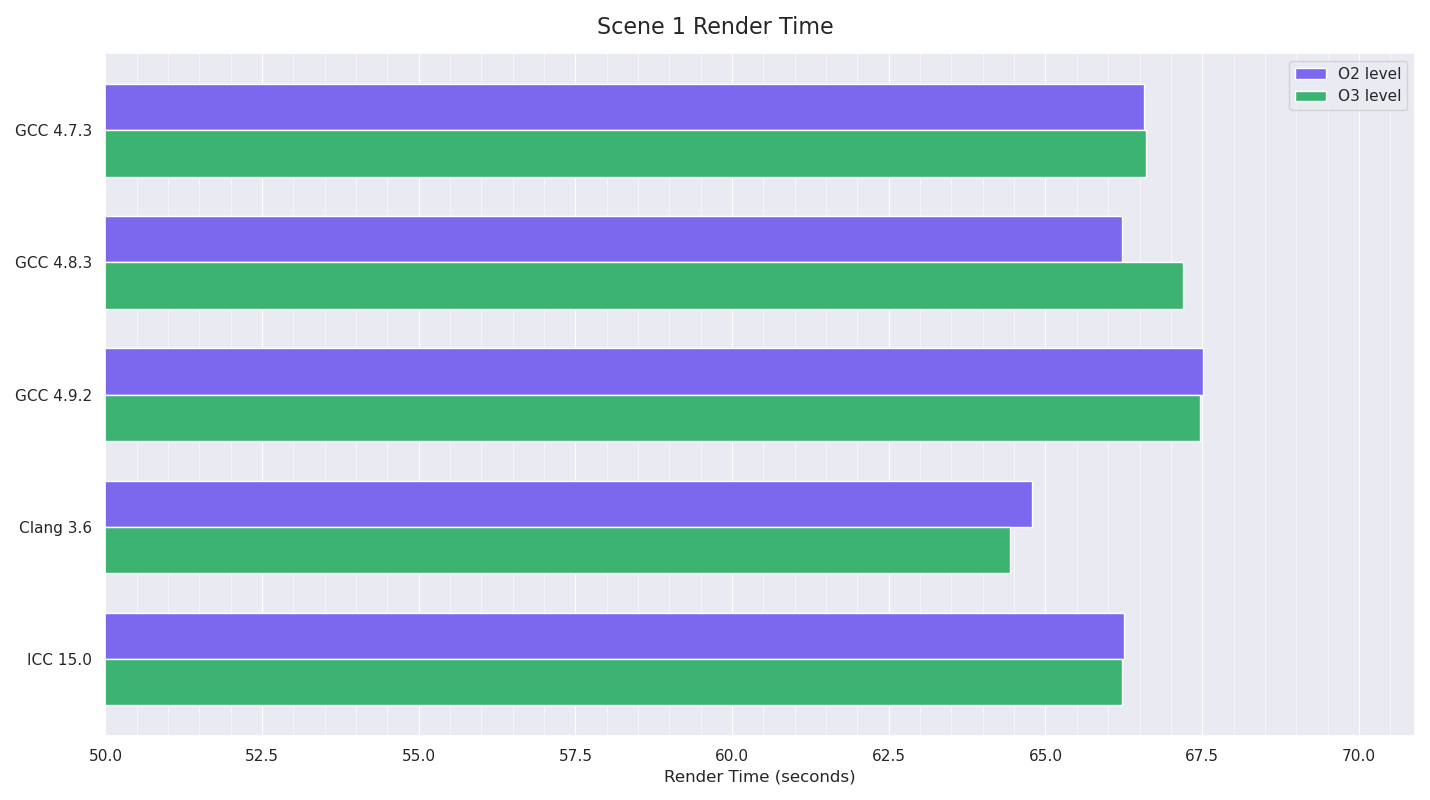
The compilers I eventually benchmarked were: GCC 4.7.3, GCC 4.8.3, GCC 4.9.2, Clang 3.6 (prerelease from SVN - with -enable-optimized configure option) and Intel ICC 15.0 trial. I did spend several hours trying to get GCC 5.0 prerelease built from SVN, but gave up after I couldn’t get it to accept either my system zlib installation or a custom one I built from source - googling seemed to indicate this was a multilib compatibility issue and I could get around it by symlinking include and lib directories for various things, but doing that didn’t work for me. I also wanted to compare earlier GCC versions, but couldn’t get 4.6 or 4.4 to build from source on my system either - again, seemingly due to multilib issues.
Comparing compilers fairly is a difficult thing to do as they all have different abilities in terms of optimisations, and even for the built-in standard -O1/-O2/-O3 optimisation types, they do different things for these. However, given the huge amount of different options they have controlling things like inlining aggressiveness and limits, loop unrolling, vectorisation, etc, it would be vastly time consuming to try every compiler option progressively to try and find the best combination for that version of compiler, although that would be the fairest test in terms of benchmarking the fastest code a particular compiler can produce for a specific set of limitations (instruction support, etc). For this reason, I’m going to stick to just comparing each compiler with both -O2 and -O3 with SSE4 support, as these are generally the starting points for using the compiler.
I decided to run three different rendering tests, each one testing slightly different features of Imagine, although there would obviously be a lot of overlap between the tests, and then two synthetic tests: one of image mipmap creation and the other of procedural noise evaluation.
Scene 1 was a fully-enclosed cubic room, but with the front wall plane invisible to camera rays allowing them into the scene. Inside were the Stanford dragon at 1M triangles with a translucent SSS material, and the Katana robot example model with a combination of metal and car paint materials. Two area lights illuminated the scene, a standard ceiling quad and a disc light behind the dragon. This test made use of brute-force multiple-scattering volumetric integration for the SSS, with uni-directional path tracing with MIS, with two light samples taken per direct lighting evaluation. A total of 5 ray bounces were allowed, with a limit for diffuse and glossy of 4, and 5 for reflection rays.
Scene 2 consisted of a large plane with a highly anisotropic metal material with a simple toy train model with diffuse, specular and bump textures and Cook-Torrance-style materials.
There was also a volume primitive backed by dense voxel grids for density and temperature with a (pretty poor) blackbody shader for the emission colour based on the temperature. Trilinear interpolation was used to lookup voxel values. The last object was a toy helicopter with metal and plastic materials, with the rotors animated and quaternion interpolation used for motion blur. An HDR environment light was used. Brute-force multiple-scattering was enabled for the volumetric integration.
Scene 3 was an extremely large plane with reflective surface and a procedural bump texture, with an island mesh with 165,000 instanced trees on it. The trees had diffuse textures on the trunks as well as procedural bump textures (simplex noise), and the leaves were constant diffuse+backlit+CookTorrance spec, with an alpha texture for cut-outs (using stochastic presence sampling for all ray types). An HDR environment light was used. This was rendered as a Deep Image (alpha), so the integrator needed to do extra work collating and possibly merging each pixel sample for each pixel.
I configured Imagine to use completely deterministic sampling (the random numbers used to generate samples were consistent between runs per thread), and all textures were pre-loaded in memory before starting the renders. Similarly geometry processing and acceleration structure building was done before starting the timers, meaning these rendering tests should be completely deterministic in terms of calculations and would only be memory / CPU bound, essentially testing raytracing intersection, light integration, texture lookups, procedural texture evaluation, etc.
-O<n> -fPIC -fp-model fast -msse4 -no-intel-extensions
(plus some experimental tests I later did with: -O3 -no-prec-div -fp-model fast=2 -xHost -inline-level=2).
My system was a dual-socket Xeon quad (E5-2643), with eight physical cores - 16 threads with hyperthreading (which I made use of for the rendering tests). Linux Kernel version was 3.5.
Timings are mean averages over multiple runs, with the system idle and making sure all CPU core temps were under 45 degC to not bias things by allowing turboboost being used differently between runs.
Results
I did some quick compile timing tests (all using eight jobs only to make sure the build wasn’t IO constrained). Three runs of each from a completely clean build, other than for ICC which kept having FlexLM license errors, so I only had the patience to do two runs for ICC. Mean averages are shown.
To my surprise, Clang was slowest: generally I’d previously found that Clang was much faster at compile time than the other compilers, and other recent benchmarks seem to show that picture as well. Running single-threaded builds of Clang and GCC 4.7 showed similar results: 6 minutes 18 secs and 4 minutes 49 seconds respectively, so I’m not sure what happened here.
(Later Edit: it turned out I had built Clang with asserts enabled, which meant it was doing extra work, and meant the timing numbers for Clang for compile times using it were inaccurate, but all other results here are valid from the build).
For the three render scene tests, Imagine was started, pre-renders were done, I ensured all the CPU core temps were under 45 degC and the system was idle, and then I rendered the scene. Rendering was done with 16 threads (using full hyperthreading of the machine), and each thread had its affinity tied to a unique CPU id (using pthread_setaffinity_np()), hopefully meaning there was less scope for the scheduler to bounce threads around different cores leading to cache misses (in the past I’ve noticed more than measurable speed improvements by doing this especially when the machine has multiple CPU sockets). Timing for just the rendering stage was printed to the console. I ran each test separately, restarting Imagine and doing the pre-renders each time (meaning memory for the images, geometry and acceleration structures would very probably be allocated in different places each time).
I did at least four tests with each compiler / optimisation level combination, often doing more when the variance between the numbers looked odd or too large. I saved the render output of two of each combination for checking later (to ensure they’d rendered the correct thing and to compare final output values).
The tests for Scene 1 had Clang as the winner by a fair margin, with GCC 4.9 very slightly slower than the previous GCC versions. Only in Clang’s case was the O3 build noticeably faster than the O2 one.
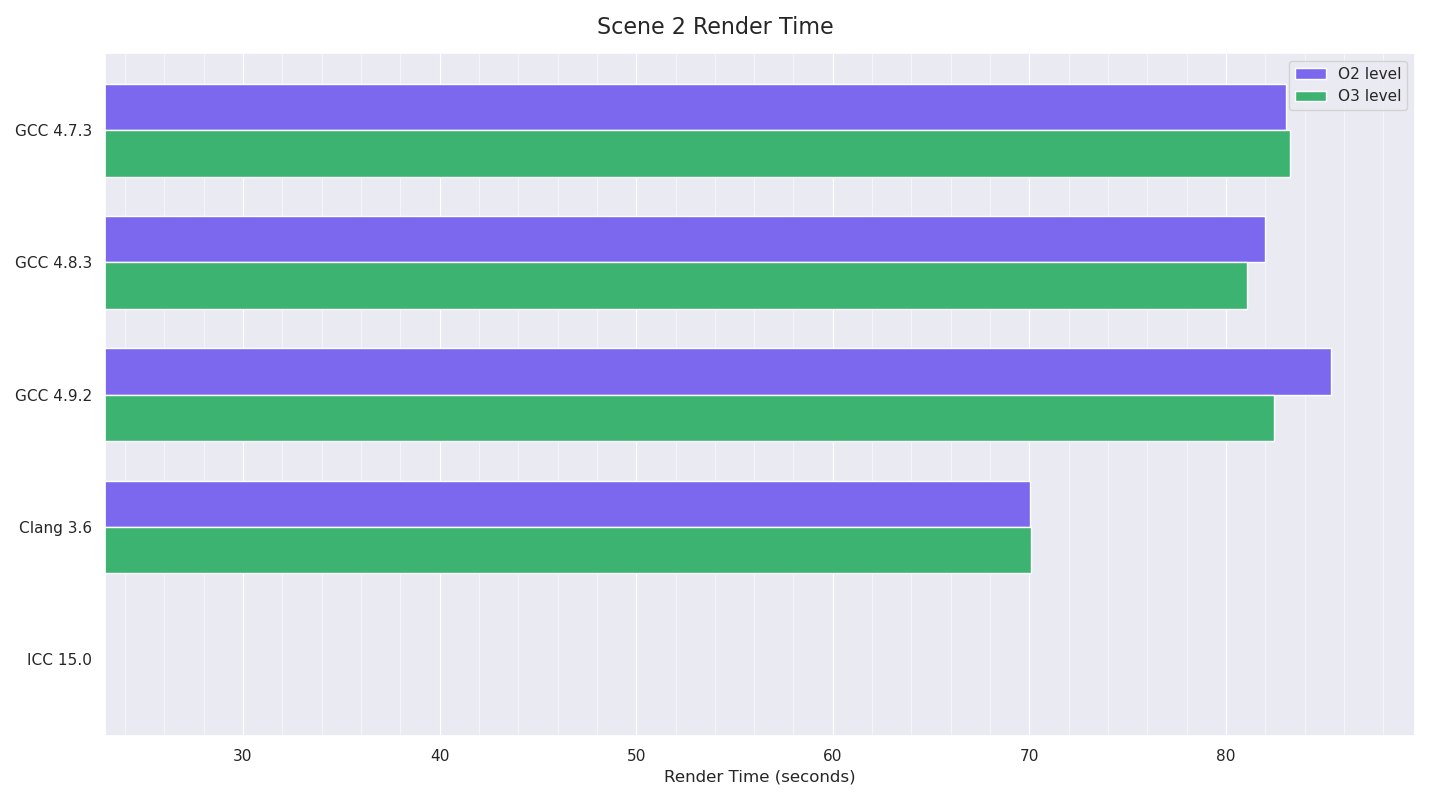
The tests for Scene 2 also seemed to have Clang as the clear winner, although I couldn’t run the Intel ICC tests as there were severe issues with the acceleration structure build code which only triggered in this test (code branches were being taken that shouldn’t have been possible). For the moment I’m putting this down to an ICC bug (given past experience with ICC, unfortunately it is pretty buggy) as marking a uint32_t class member variable as volatile “fixed” the issue, but it definitely seemed that ICC was emitting code that would not copy across all the bits of a uint32_t and so was truncating it, leaving some bits uninitialised. This code was only running when motion-blur was being used for an object (the helicopter’s blades in this case) - basically a special type of primitive clipping that works well with motion blur bounds. I added debug code to verify that none of the other compiler builds were doing things wrong in that place, and as I didn’t want to test ICC with this volatile modification which shouldn’t have been needed, I just skipped it.
GCC 4.9’s results however, showed that the timings were pretty inconsistent: ranging from 88.43 seconds to 82.39. I couldn’t find any pattern to this: the system was idle, CPU temp was down before starting, output results for all the different compilers matched almost exactly (the fast math option was enabled for all compilers, meaning the compilers weren’t required to always stick to IEEE float precision, and thus there were minor variations in the results of some of their calculations, but the differences of the final render outputs were extremely minor), until I discovered that doing successive renders with the GCC 4.9 builds with the same pre-render state gave much more consistent results. Given that all the builds were doing almost exactly the same thing (very minor floating point value differences as pointed out above), this pointed to data memory layout differences causing this, possibly even due to memory alignment issues, but more likely due to differing memory layouts of things like acceleration structure nodes, geometry, etc affecting memory pre-fetching or branch prediction in some way due to the code GCC 4.9 was generating. None of the other compilers showed this issue. The only other difference with the GCC 4.9 tests was that I had to set LD_LIBRARY_PATH to point to the GCC 4.9.2 install’s lib64 directory for a newer version of libstdc++.so.6 in order to run these builds. However I don’t think this was the cause of these timing inconsistencies as I tried running some of the other compiler executables with this modified LD_LIBRARY_PATH (and verified using LD_DEBUG=files output that this newer lib was being used), and the other compiler builds I tested still didn’t exhibit this issue.
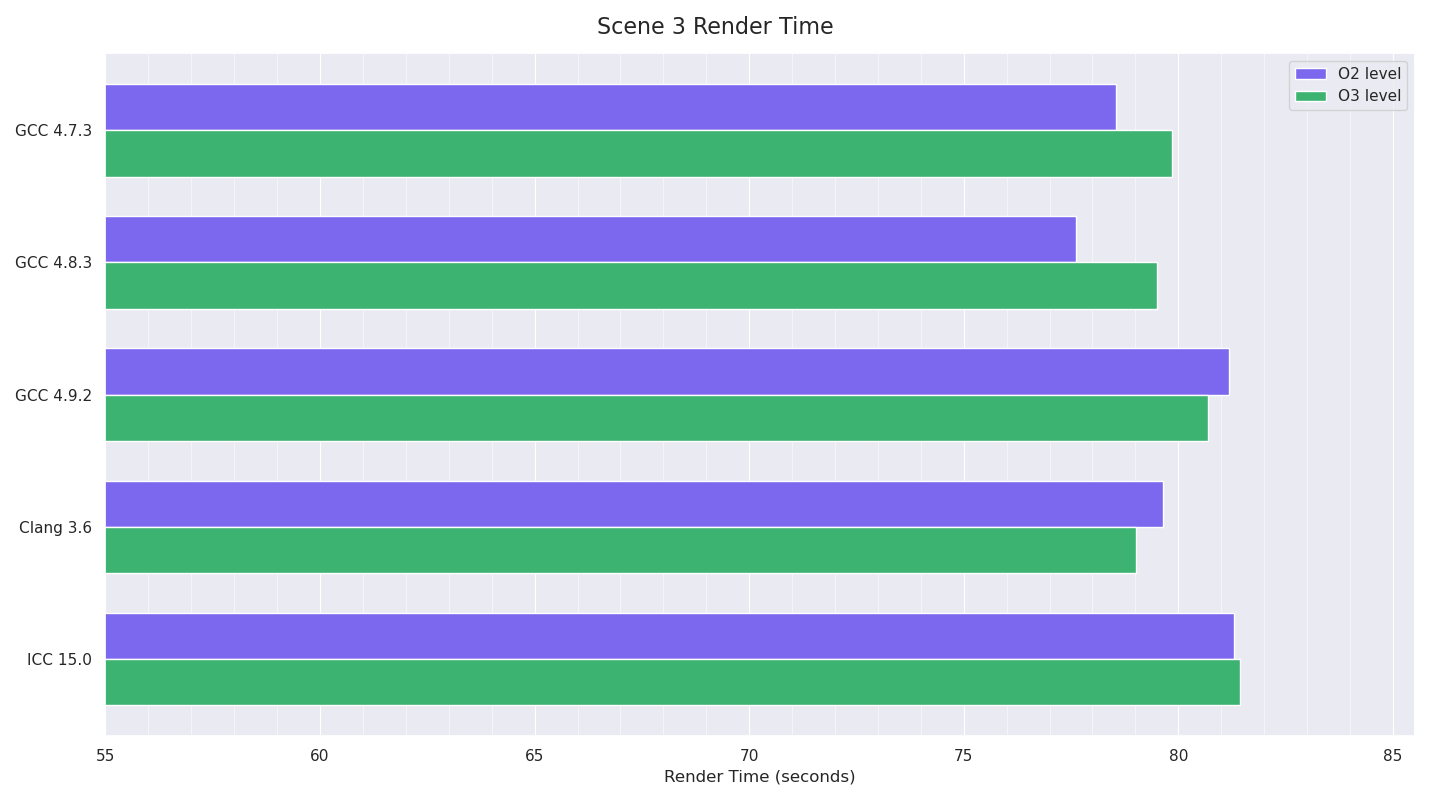
Scene 3’s tests are a much more mixed bag with no outright winner, although the O2 builds of GCC 4.7 and 4.8 were the quickest. Again, GCC 4.9 showed varying results, and as before, using the same pre-render state and doing consecutive renders gave much more consistent results (which I didn’t include in these results).
Due to the fact these rendering tests were testing quite a lot of different things at once, and I was slightly concerned about the fact that the ICC builds couldn’t run Scene 2’s test, as well as the fact that ICC wasn’t winning any of the tests (when I last benchmarked the compilers over two years ago, ICC was consistently > 25% faster than the other compilers), I decided to turn my attention to more simple synthetic tests.
For the two synthetic tests, I stubbed Imagine infrastructure code into much smaller separate executables, with code just running in the main thread (still with affinity set).
The Mipmap test involved opening 6 8K 16-bit half RGB scanline OpenEXR files from disk, keeping them in memory (at full 32-bit float precision after conversion) and repeatedly generating filtered mipmaps for these images, 11 times each in rotation (so effectively doing 66 mipmap generations).
I only started timing after the images were loaded off disk and converted to 32-bit float format, so the benchmark should be CPU and memory constrained only (quite a few memory allocations).
In this test Clang and ICC lagged GCC significantly, with GCC 4.9’s O2 benchmark strangely slower than the other GCC timings.
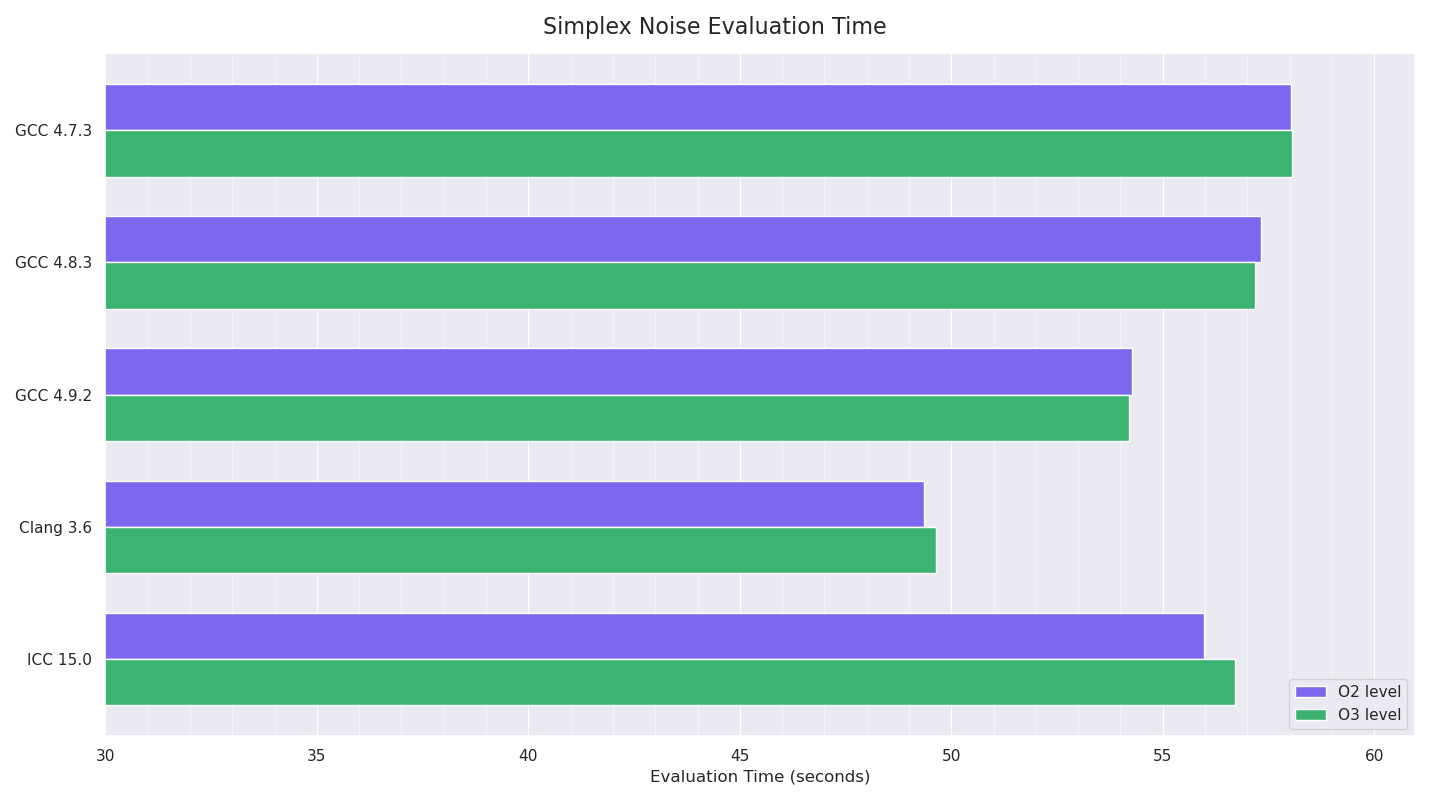
The procedural noise test involved iteratively evaluating 3D simplex noise at regular intervals at positions in the shape of a cube (stepping in each dimension), for a total of 1,194,389,981 evaluations.
I disabled the SSE intrinsics support I had for this code, so it was just pure float / int operations and branching, to see what the compilers could do. This test should be fully CPU-constrained.
Clang won this test by a fair margin, with GCC 4.9 next fastest and ICC followed. I was still really confused by ICC’s poor showing, and started experimenting with more aggressive compiler options: -O3 -no-prec-div -fp-model fast=2 -xHost -inline-level=2
allowing less precision, using all instruction sets the host processor supported and more aggressive inlining at the compiler’s discretion. Doing this knocked a few seconds off the timings for ICC, but I’m almost certain (but didn’t test) doing equivalent things for the other compilers would have done like-wise.
Two years ago, libm’s maths functions (definitely transcendentals like pow(), sin(), etc) were pretty bad in CentOS 4/5 (often to the point that using double precision was significantly faster than the standard float versions), so using ICC meant that it had the ability to replace these functions with Intel’s own optimised ones (which at the time were much faster than libm’s) and statically link them inside the executable. Analysing the symbols in the built executables for ICC and the other compilers showed ICC 15.0 was doing this: most maths symbols for the non-Intel builds were Undefined, with them pointing to GLIBC, whereas ICC’s builds had the symbols in the executable.
So I can only conclude that either GCC and Clang have become much faster over the past couple of years, or libm’s maths functions are a lot faster than they used to be. Both of which I think are probably the case.
I’ll need to do some profiling to work out what’s causing the GCC 4.9 builds to be so inconsistent, as that appears to be why when I first benchmarked with GCC 4.9 it seemed slower.
This isn’t the most comprehensive C++ benchmark, but I think it’s a pretty fair comparison given that the compilers were all limited to a relatively similar degree - while the different compilers do different things at their respective O2/O3 levels, they have the same intent in that they’re recommended starting points, and O3 might be too aggressive in some cases - and taking into account how time-consuming it would be to play around with all the different optimisation flags for the different compilers. I would though have liked to have got GCC 5.0 built from SVN and to also compare the compilers with whole program optimisation, link time optimisation and profile guided optimisation, and to see what benefits those options might have brought over the more standard optimisations.